Ask any store how the season went and you get one number: total revenue. Ask how that revenue split, and there usually isn't an answer ready, because nobody sat down with it while the season was running.
The total answers one question. Are you happy or not. What you do next season is answered by the split.
Demand rises during a season whether you advertised well or badly. That's why a season total is rarely a verdict on what the team did.
Four questions stay open, and all four feed next season's plan:
- Which channels produced the revenue, and at what cost per riyal
- How much went to new customers and how much to people who already buy from you
- Which products carried the season, and whether those are acquisition products or repeat products
- Whether the spike was real growth or orders that would have arrived a month later anyway
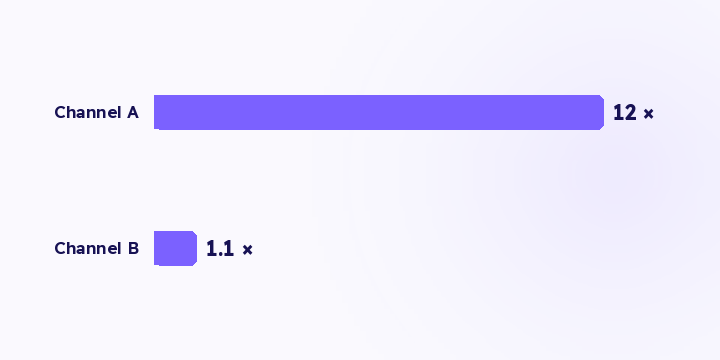
Take a seasonal week with 128,450 SAR of revenue and a blended 7.4×. That figure accepts a lot of combinations, including one channel at 12× and one at 1.1×.
The first deserves more budget next season. The second deserves to be paused or rewritten. The average of the two tells you one thing: carry on as you are.
In an ordinary month, blended return is a rough summary but a stable one. During a season the spread between channels widens sharply, because creator posts spike and stop, retargeting pools saturate, and prospecting costs rise while everyone bids on the same days.
There's a profit layer underneath all of it. Return counts sales rather than profit, so a channel at 12× on a thin-margin product can be worth less than a channel at a lower return on a healthy-margin one. More on that in profit instead of ROAS.
Most stores never ask this, and it's the most expensive question of the season.
A discount season can move demand instead of creating it. The customer who would have bought in three weeks buys now, at a thinner margin. The season looks strong, the month after looks weak, and they're the same event.
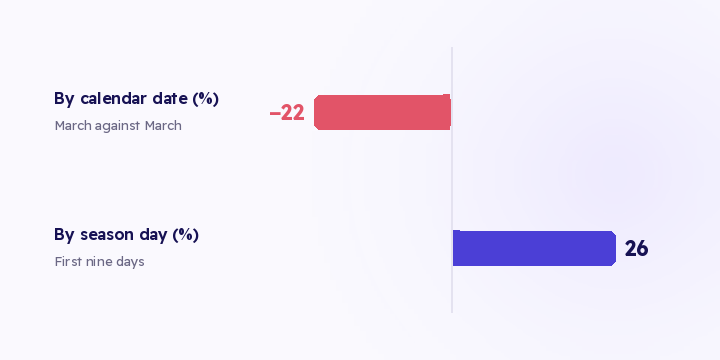
One comparison shows it: the four weeks after the season, this year against last year. If the month after sits close to normal, the season created demand. If there's a dip roughly the size of the spike, you pulled orders forward from next month and discounted them.
Finding a pull-forward doesn't mean stopping seasons. It means changing the shape of the offer: a smaller discount on products that sell anyway, and a stronger offer on the products that bring in a new customer. The difference between the two shows up in the new-versus-returning split.
| Split | Question it answers | What it changes |
|---|
| Revenue by source | Which channel carried the week | Where next season's budget goes |
| New vs returning | Did you buy customers or discount to existing ones | Whether the discount was worth it |
| By product | What actually sold, and to whom | Stock and bundle planning |
Run the first during the season, because it changes tomorrow's decision. The second and third belong in the readout, since they need the season to finish before they mean anything.
In the second split, the number to look for is the new-customer share of season orders against their share in an ordinary month. If the share rose, the season brought you people you can sell to again, and the discount was an acquisition cost. If it fell, you discounted to buyers who would have paid full price.
All three splits share one condition: every order has to arrive with its source, counted once. If a large share of season orders sits in "direct", every split reads wrong, and the channel that brought the customer gets no credit.
Revenue by source is live in Flowfy today, and new versus returning reads off unified customer records. Joining ad spend from platform accounts, season shading and the product-level split are on the roadmap and haven't shipped. See product-level decisions and joining ad spend to orders for what that means in practice today.
After any season, spend an hour on two splits: revenue by source, and new versus returning. Before you take the year-on-year growth figure as settled, compare the four weeks after the season to the same weeks last year.
For season-against-season comparison rather than previous-period, see measuring a Saudi season.