


Seasons
Pick the report period from the question, not the default
Last 7 days, last 30 days, this month. All three were chosen for convenience, not for a question. Here's how to pick the range from the question you actually have.
2 min read
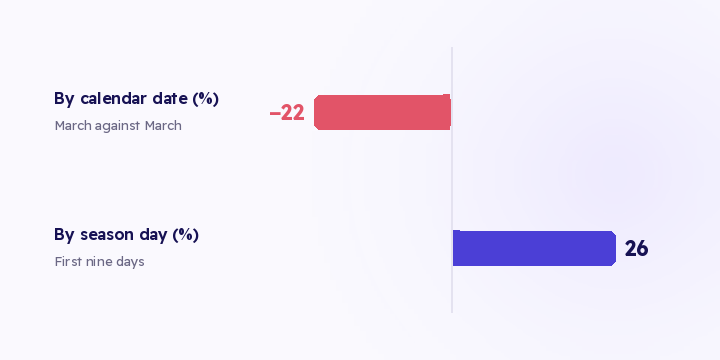
Compare March to March and your revenue looks 22% down. Align the same data by Ramadan day and it's 26% up.
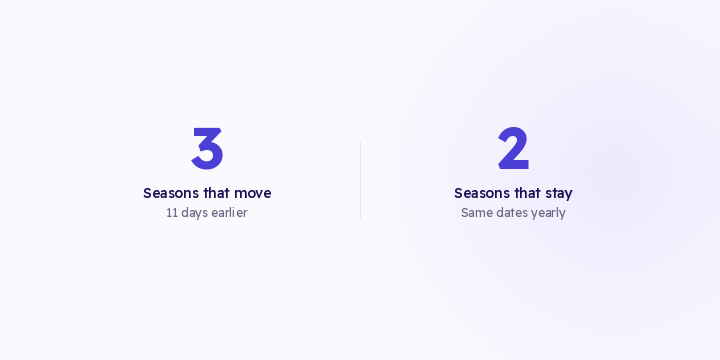
The difference isn't in your store. Ramadan moves about eleven days earlier each Gregorian year, so one March holds twenty Ramadan days and the next holds nine. Comparing the two months puts a full season next to half a season.
| Ramadan days in the month | Revenue | |
|---|---|---|
| Last March | 20 | 400,000 SAR |
| This March | 9 | 310,000 SAR |
By calendar date: (400,000 − 310,000) ÷ 400,000 = a 22% drop. You read that over coffee and conclude the season failed.
By season day, the first nine days of Ramadan against the first nine of last Ramadan: 189,000 SAR against 150,000 SAR, which is 26% growth.
The first reading has you cutting budget and the second has you adding it. The arithmetic didn't change; the choice of periods did. The first nine days of a season carry the same buying behaviour in both years, and March doesn't mean the same thing in both years.
Three references, in order of usefulness:
The same season last year. Same number of days, same buying behaviour. In seasonal trade that's the only year-on-year comparison that answers a growth question.
The previous period. Useful for spotting a trend while you're inside the season. Not useful for judging performance, because any season comes in above the month before it.
A period you pick yourself. The last ten nights against the first ten, or Eid week against the week before it.
Eid deserves its own baseline. Fold it into Ramadan and you lose the read on both.
Before you compare anything, shade the season days on the chart. When the line jumps, the chart itself tells you whether your campaign moved it or the calendar did. Season shading and saved season comparisons are on the Flowfy roadmap and haven't shipped, so today you pick both periods yourself and note down which two you used.
The season is thirty days. A decision you take on day twenty can't repair week one. And the report that lands after Eid arrives with nothing left to change.
Why the trend matters: two channels sit at roughly the same return today, one falling from 5.2 and one climbing from 1.4. In the table those two look equal, but the second one is heading up and deserves part of the budget.
The nightly routine takes two minutes. Revenue by source, your order count against the matching day last season, and pacing against budget. If one of those drifts two nights running, that's when you step in, not at the end of the month.
What stops tracking during a season is rarely traffic load. It's usually an expired token, a missing permission, or an old pixel ID left over from last year's campaign. Events come back rejected with no notification, so there's no error in your store, just numbers quietly falling short.
Three lines to check at least two weeks out:
The cost of finding out late is easy to work out. A store spending 6,000 SAR a day with tracking broken for three days has spent 18,000 SAR with no conversion signal going back to the platforms. The orders weren't lost; your store recorded them and the money arrived. What was lost is the signal the algorithm learns from.
Automated alerting when events stop is on the roadmap and hasn't shipped. Until it does, the substitute during a season is a daily comparison you run yourself.
Two weeks before the season, check every destination credential and follow one event all the way through. Afterwards, compare by season day rather than calendar date, and follow the season cohort into the next month: if they came back, that was growth, and if they didn't, it was a peak.
Last 7 days, last 30 days, this month. All three were chosen for convenience, not for a question. Here's how to pick the range from the question you actually have.
Every tool defaults to previous period. That default answers a different question than the one in your head. Here are the three comparisons, and which one judges performance.
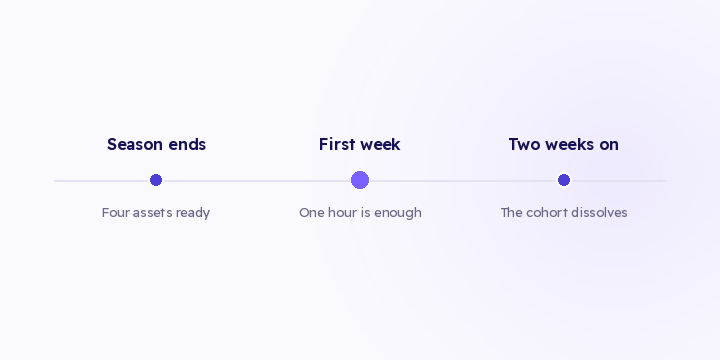
A season leaves four things behind besides revenue. All four decay within about two weeks if nobody claims them, and claiming all four is an hour of work.