A season gets treated as an event to survive, then a number to report. It's also the densest week of behavioural data you'll collect all year, and almost none of it gets used.
The idea here is a single one: the season is an experiment you already paid to run, and it produces three findings worth carrying into next year's plan.
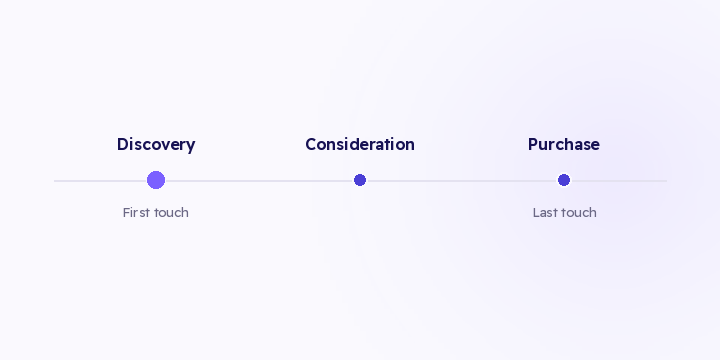
Ordinary months make this hard to see, because journeys stretch over weeks and overlap. A season compresses them. A customer often discovers, considers and buys inside 72 hours, so the whole path sits in one window you can actually read.
Look at orders where a channel was the first touch against orders where it was the last. The difference between those two counts tells you which channels do the discovery work in your store.
That finding changes the shape of next year's budget more than any creative decision, because the channel that opens most journeys is the one that looks worst on last click, and it's the first thing cut when budget tightens.
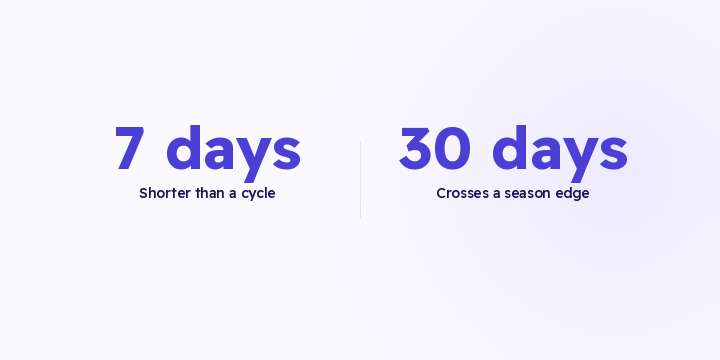
The gap between first touch and purchase, measured across a full season, tells you whether your customers decide in hours or in weeks. No external benchmark can give you that number for your own store.
It has two direct consequences:
- Your attribution window. If a meaningful share of season orders trace back to touches that happened before the season started, a 7-day window was erasing them all year.
- When to start spending. Most stores find their season begins earlier than their campaigns do, and that the lift started before the launch they credit for it.
Touchpoint journeys and first-touch versus last-touch comparison are live in Flowfy today on a 90-day attribution window, which is what makes the first two findings readable at all. Period comparison and season shading are on the roadmap and haven't shipped, so comparing this season against last year's currently means selecting both ranges yourself.
Every season exposes at least one failure: a destination that went quiet, a theme change that dropped events, or a channel whose orders all landed in the direct bucket.
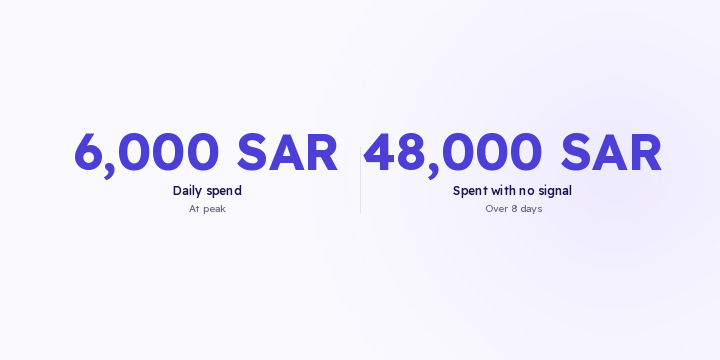
The failure itself isn't the finding. The finding is how many days it took to notice, because that same number applies next season while you're spending more.
Write it down while it's fresh, along with the destination or template that caused it. Note what made you notice, too: a weekly report, someone spotting a sales dip, or the daily check. Whatever caught it this time is what will catch it next time, and if that was a weekly report you already know your detection window is seven days.
"This channel works, that one doesn't." Season performance is a weak predictor of ordinary-month performance. Costs, competition and intent all differ. A channel that carries a season can be mediocre in February and still worth keeping for four weeks a year.
"The discount depth was right because revenue rose." Revenue rises in a season regardless. The pull-forward test, meaning the four weeks after, this year against last, is what settles that question.
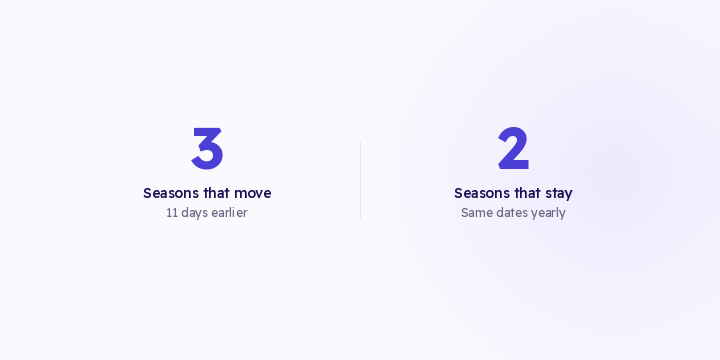
"Let's repeat it exactly." Ramadan moves about 11 days each year. Copying last year's calendar dates is how a store repeats a plan against a different season.
Three lines in the readout, and one in the calendar:
- Which channels opened journeys, with the first-touch versus last-touch difference
- The typical first-touch-to-purchase gap, in days
- What broke, and how many days it took to notice
- A calendar reminder four weeks before next year's season, pointing at the pre-season checks
That's the whole carry-forward. It fits on one screen, and it gets opened during planning instead of filed in a deck.
Is a season representative enough to learn from?
For journey shape and buying cycle, yes. For channel cost efficiency, no, because season costs aren't ordinary-month costs.
When should I run this analysis?
After the four-week pull-forward window, alongside the final readout.
What if this was our first season with proper tracking?
Then it's your baseline. The most useful thing you can do is write it down clearly enough for next year to compare against.
Does it apply to short seasons like Eid?
Yes, and more clearly. The compression is greater, so journey shape is easier to read.
The first thing to do after the readout: compare first touch against last touch on your season orders. If the difference is large on a channel, don't cut that channel on last-click numbers before next year's season.