

Profit
Why a campaign at 4× ROAS can lose money
ROAS counts sales, not profit. Once cost of goods, shipping and gateway fees are in, your campaign ranking changes. Here's the arithmetic and what to do about it.
3 min read
ROAS was above 3 all month, and the bank balance disagrees.
Between those two facts sit four costs. Not one of them appears in the ad report, and all of them come out of the same revenue. The fastest way to see the difference is to compare two campaigns.
| Sales | ROAS | Product margin | After cost of goods | Result | |
|---|---|---|---|---|---|
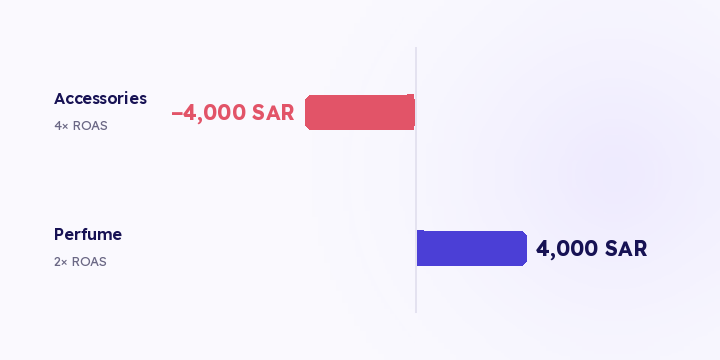
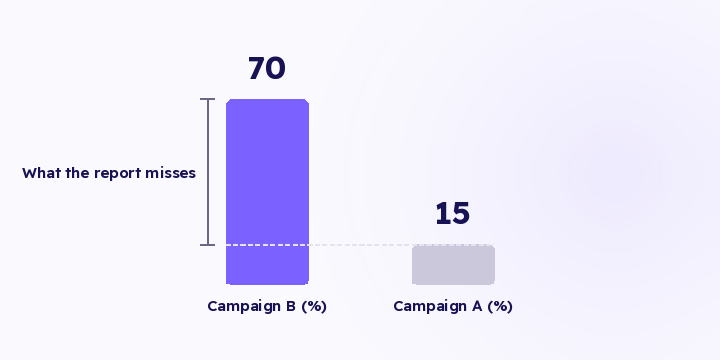
| Campaign A | 40,000 SAR | 4× | 15% | 6,000 SAR | −4,000 SAR |
| Campaign B | 20,000 SAR | 2× | 70% | 14,000 SAR | +4,000 SAR |
Illustrative figures, with 10,000 SAR of ad spend behind each campaign.
The 4× campaign loses money and the 2× campaign makes it. Nothing in the ad report shows you which is which, because it knows the spend and it knows the sales, and it knows nothing about the margin in between.
1. Cost of goods. The largest and the most variable. Margin differs a lot between products, so a channel selling your low-margin items at a strong ROAS can be less profitable than one selling high-margin items at a weaker ROAS.
2. Shipping. Rarely uniform. Weight, destination, speed and whether you absorbed it all vary by order. A channel whose buyers sit in expensive-to-serve regions carries a cost that never reaches the ad report.
3. Payment gateway fees. They differ by payment method, and the differences aren't small. Deferred and instalment payments carry higher fees than cards, so a channel whose buyers prefer them has a higher cost per order.
4. Returns. The one most often forgotten. A channel with a high return rate is credited with revenue that came back, and every efficiency figure about it is overstated until refunds are subtracted.
If all four were the same share on every channel, ROAS would be a reasonable stand-in for profit. They aren't, and the variation is systematic rather than random:
That's why ranking campaigns by ROAS gives a different order from ranking them by profit, and the two rankings tend to disagree most at the top of the list, which is where most of your spend sits.
In Flowfy, attribution, order-level source and the channel reporting this method relies on are live. Storing cost of goods, shipping and gateway fees to show profit per channel is on the roadmap and hasn't shipped. See ROAS versus true profit. The arithmetic above doesn't wait for it; you can run it in a spreadsheet against your attributed revenue today.
Do I need an exact shipping cost per order? No. An average shipping cost per order by region gets you most of the way. Including it at all matters more than getting it precise.
What about free shipping offers? That's a cost you absorbed, so it belongs in the calculation. A channel whose orders sit below your free-shipping threshold costs you more than one whose orders sit above it.
Does this change my ROAS figure? No. It puts a second number next to it. ROAS stays useful as an intermediate signal, and profit is the decision figure.
Can I see profit per product? Per channel, you can compute it today from exported data. Per product needs product analytics, which is on the roadmap. See product decisions.
Take your two largest campaigns from last month and subtract cost of goods, shipping, gateway fees and returns from each one's revenue. If the ranking changes, move a small part of the spend and watch profit for a month before moving more.
ROAS counts sales, not profit. Once cost of goods, shipping and gateway fees are in, your campaign ranking changes. Here's the arithmetic and what to do about it.
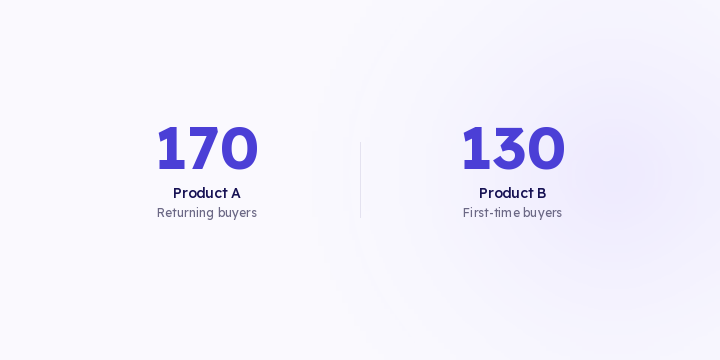
Budget is decided by channel. Stock, bundles and offers are decided by product. Two products with the same revenue can need opposite decisions, and revenue alone doesn't tell them apart.
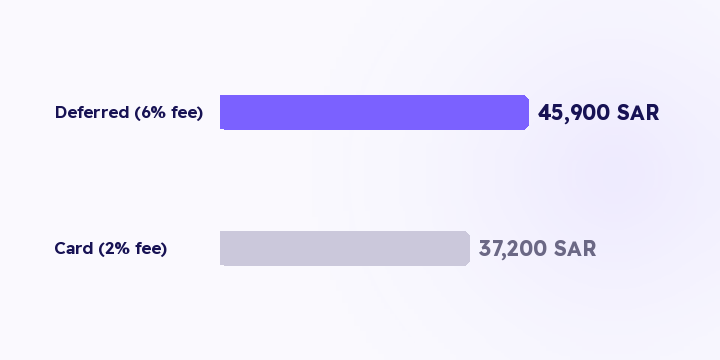
Deferred payment carries higher fees and a bigger basket. Which of those wins is an arithmetic question, and most stores answer it with an opinion. Here's the maths on a hundred orders, and six steps to run it on your data.