How to measure spend and revenue with the same ruler
Return is a ratio between two numbers. If the two are calculated in different ways, the result isn't a rate. Here are four ways the sum breaks, and the rule that fixes it.
1. Revenue from your store, conversions from the platform. You divide your store's revenue by a conversion count the platform produced under its own window and its own rules. The two aren't counting the same events.
2. Adding platform conversions into one total. Sum conversions across destinations and you'll get a figure larger than your real order count, because each platform claims the orders it touched. See why Meta reports more.
3. Attributed revenue against total spend. Revenue credited to one channel by your model, divided by all your spend including the portion that never matched a campaign. The top number is narrow and the bottom one is wide.
4. Different periods. Revenue over a calendar month against spend over the same month, when the orders in that revenue came from clicks in the month before.
All four produce a number that looks plausible. None of them produces a number you can compare.
One order, credited once, on your side. Spend joined on an identifier both sides recognise. The same period on both numbers.
That's the whole discipline, and the rest of return measurement branches off those three.
The first clause is why attribution has to be yours: four platforms each claiming the same order can't produce one number on top. The second is why the join key matters, covered in joining ad spend. The third is the one people forget.
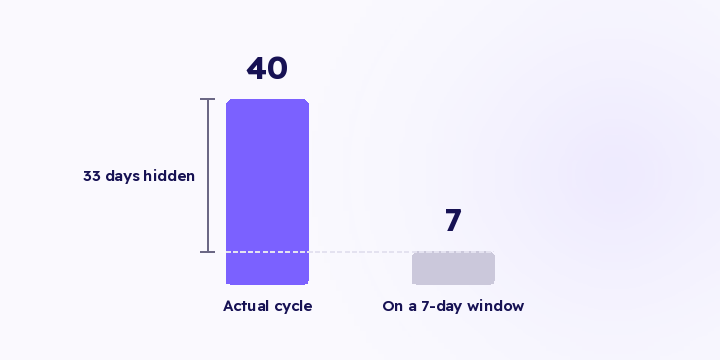
Spend happens on a date. Revenue arrives when the customer decides, which can be weeks later.
For a store with a two-day buying cycle, month against month is close enough. For a store with a 30-day cycle, a calendar month compares this month's spend against last month's decisions. That mismatch is systematic rather than random: it makes a growing account look worse and a shrinking one look better.
Two practical responses. Read return over a period at least three times your buying cycle, and read direction rather than level when the cycle is long. See buying cycle.
The third only works if the first two do. Subtracting real costs from an inflated return gives you a profit figure that's wrong with more decimal places.
In Flowfy, attributed revenue on your side, one order counted once, over a consistent 90-day window, is live. That's the top half of the rule. Joining ad spend from the ad accounts is on the roadmap and hasn't shipped. Until it does, the spend figure comes from your ad accounts and you do the join in a spreadsheet. The rule doesn't change; it just takes manual work to enforce.
Should my numbers match the platform's?
No, and expecting that wastes your time. Each platform counts its own claim over its own window. Yours is the number that arbitrates.
What period length should I use?
At least three buying cycles for comparing levels. Shorter periods are fine for reading direction.
What about organic revenue?
Return on ad spend should have ad-driven revenue on top. Including organic revenue inflates every channel, which is what last-touch on brand search does quietly.
Is return the right metric at all?
It's a useful intermediate. The decision metric is profit, and return is one input to it.
Before you compare two channels on return, check three things: the order is credited once on your side, spend is joined on a clear identifier, and both numbers cover the same period. If any one is missing, you're comparing two figures that don't compare.
The gap between first touch and purchase is a fact about your product that no benchmark supplies. It sets your attribution window, when you start spending before a season, and how long you wait before judging a campaign.
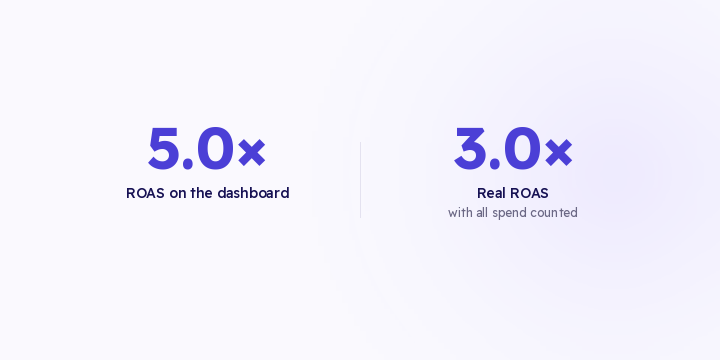
A 5.0 ROAS on the dashboard is worth checking before you celebrate. If 40% of your spend never matched a campaign, the denominator is short and the number is wrong in the direction you like.
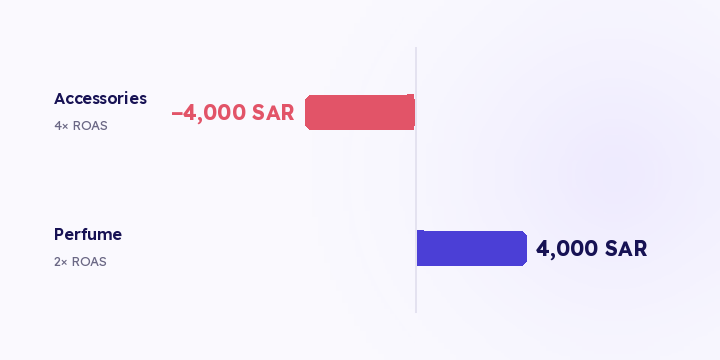
ROAS counts sales, not profit. Once cost of goods, shipping and gateway fees are in, your campaign ranking changes. Here's the arithmetic and what to do about it.