"We tried a lot of creatives this month. Two worked. None of us knows why."
That line comes up in most performance meetings, and it isn't a failure of attention. Testing happens at the whole-ad level, so the winner tells you that this particular combination worked and nothing about which part of it did.
Export a report from Ads Manager, sort creatives by ROAS, and you get a list. The list tells you which ones to keep running. It doesn't tell you what to make next, and next is where the budget goes.
The reason is sample size. One ad carries a small number of conversions plus its own variance, so the difference between two ads usually can't be separated from randomness.
The fix isn't collecting more data per ad. It's sorting the twelve ads into two groups by a shared element, so each group's sample is several ads instead of one.
Twelve creatives, 5,000 SAR each, 60,000 SAR total. Grouped by opening shot:
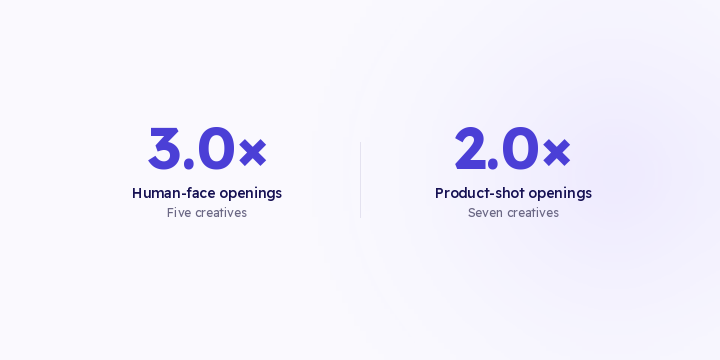
- Seven open on a product shot: 35,000 SAR spend, 70,000 SAR revenue, so 2.0×
- Five open on a person talking: 25,000 SAR spend, 75,000 SAR revenue, so 3.0×
Same twelve ads, same data. What changed is that each group's sample is five or seven ads rather than one, so the difference shows instead of dissolving into noise.
And the result is something you can act on. The next batch opens on a person.
- Opening shot: product, person, text, or result
- Whether a human face appears, and how early
- Register and dialect: standard Arabic against colloquial, and which colloquial
- On-screen text: present or not, and how soon
- Length, in bands rather than seconds
- Offer framing: by price, by benefit, or by problem
Tagging is manual, and the tagging is the work. Twelve creatives take an afternoon, and the tags keep paying off on every batch after that.
If you moved the product group's budget into the face pattern at the same return, you'd get 35,000 × 3.0 = 105,000 instead of 70,000.
Treat that as a sizing estimate, not a forecast. The winning pattern can saturate, and an audience that sees more of it can respond less. What holds is the narrower point: grouping by element grows your sample and shrinks your noise.
How many creatives do I need?
Enough that each group holds several ads. Below roughly eight to ten in total, the groups get too small.
Can I tag on more than one element at once?
Start with one. Two elements halve your sample per group, and most stores don't have the volume.
Does this replace creative testing?
No. It changes what you conclude from it. Test ads, learn elements.
What about dialect specifically?
It's worth tagging in this market, and worth testing rather than assuming.
Targeting is automated and budget is algorithmic, so creative is the part still genuinely in your hands.
Take your last batch of ads, tag them on one element, and total spend and revenue per group. Order source down to the individual ad is live in Flowfy, so revenue attributed on your side groups by whatever classification you apply. Arabic creative analysis, meaning reading the ad itself, is on the roadmap and hasn't shipped. Until it does, that classification is a column you fill in a spreadsheet.