

Growth
What the second purchase journey looks like
The second order has its own journey and its own channels, and it's the cheapest revenue you have. Here's the arithmetic, and the time gap that decides when to act.
3 min read
A repeat rate of 20% is one number describing customers who have had wildly different amounts of time to come back. The person who arrived three weeks ago and the person who arrived two years ago sit inside the same percentage.
One idea fixes that: group customers by when they arrived, and read them at the same age.
A cohort is a set of customers who made their first purchase in the same period, whether that's a month, a season or a campaign. You read them forward: how many came back after 30 days, after 60, after 90.
That gives you a curve instead of a number, and the curve answers questions the number can't:
Building the table is simpler than it sounds. One row per first-purchase month, one column per age marker: 30 days, 60, 90. Each cell holds the share of that month's customers who had come back by that age. Read across a row to see how one cohort behaves over time, and read down a column to compare every cohort at the same age.
The comparison only holds at equal age. September's cohort at 60 days against August's cohort at 60 days. Comparing a mature cohort with one that's two weeks old favours the older one every time, because it has had longer. See repeat purchase journeys.
A single rate answers one question, which is what share of my customers came back. It doesn't tell you when they came back, whether returning is improving, or which of them returned.
There's a deeper problem. The blended rate moves whenever your acquisition volume moves, even when retention itself hasn't changed. So before you read a repeat rate, check how many new customers arrived in the same period.
Scale acquisition sharply and your repeat rate drops. Not because customers stopped coming back, but because you added a large group that hasn't had time to.
Every store that expands sees this, and some conclude they have a retention problem and spend money fixing it. Cohorts separate the two cases in one view: if September's cohort at 60 days sits above August's cohort at 60 days, retention is improving whatever the blended number says.
This is exactly where cohorts change spending decisions.
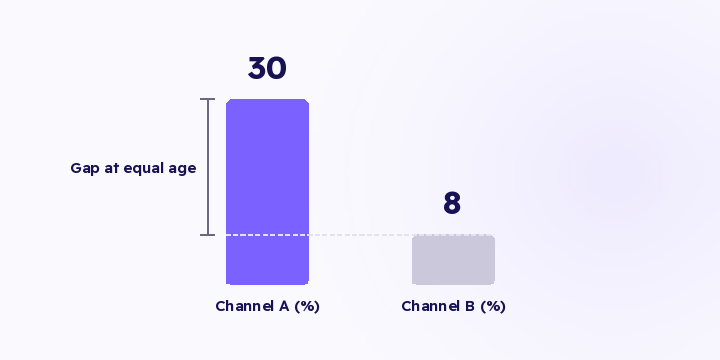
Two channels can share a new customer cost and have completely different curves. If 30% of the first channel's customers have returned by 90 days and 8% of the second channel's have, those aren't equally priced acquisitions even when the cost per customer matches. That difference is invisible in any metric that stops at the first order, which is why channels bringing repeat buyers stay underfunded for long stretches.
The practical move isn't to switch the second channel off. A channel whose customers don't return can still suit a particular product or a season, but the ceiling on what you'll pay there is lower and has to be worked out on the first order alone.
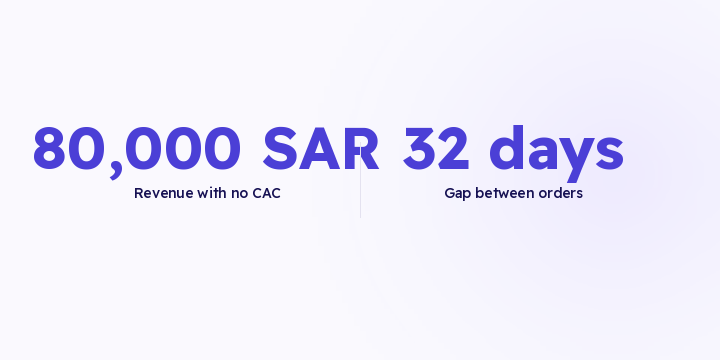
Cohorts give you timing too. If the typical gap between first and second order is 32 days, a win-back campaign going out on day 60 reaches people who have already decided not to return, and a reminder on day 20 pays for orders that were coming anyway.
Use monthly cohorts for most stores. Weekly if your volume is high, quarterly if it's low and monthly cohorts come out too small to read.
Follow each cohort for at least two repeat cycles before judging it. For most stores that's 60 to 90 days, and longer for considered purchases.
You need identity resolution before any of this. Without it, a customer returning on a new device counts as a new customer, which understates every cohort in the same direction and pulls all your curves down.
Flowfy gives you identity resolution, the full order history per customer, and acquisition source at order level. From exported orders you can build cohorts grouped by first-purchase month and split by acquisition channel. Cohort retention curves and lifetime value by first acquisition channel as a packaged view are on the roadmap and haven't shipped. See nCAC and cohorts.
The second order has its own journey and its own channels, and it's the cheapest revenue you have. Here's the arithmetic, and the time gap that decides when to act.
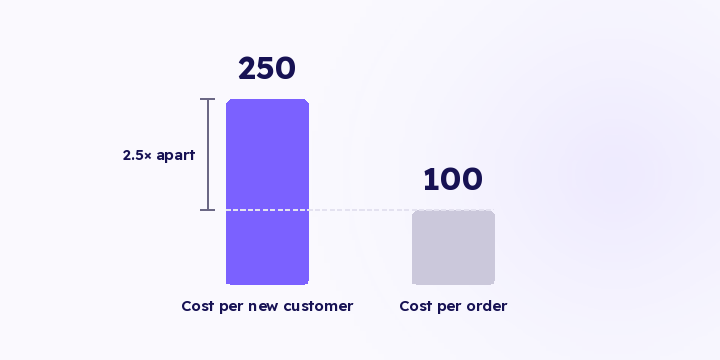
Spend divided by all orders flatters every campaign that resells to your own customers. Here's the arithmetic, and the order to work through to LTV by channel.
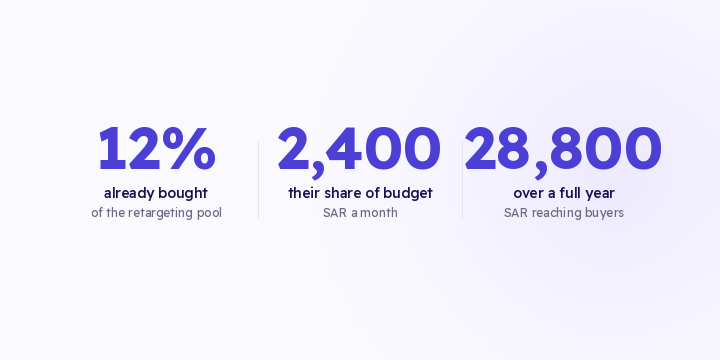
12% of a retargeting audience has already bought, and their share of the budget is 2,400 SAR a month. The waste never shows up as a loss anywhere, which is why it runs for years. Here's the arithmetic and the exclusions to run.