

Growth
How to give packaging and print a cost per order
Offline touchpoints cost you money and have no revenue line facing them. One code on something you already print turns them into a channel you can compare against paid.
3 min read
Most writing about attribution reads as though customers buy once. The second order has a different journey, and because it's usually credited to whatever closed it, the channels that actually bring a customer back barely show up in any report.
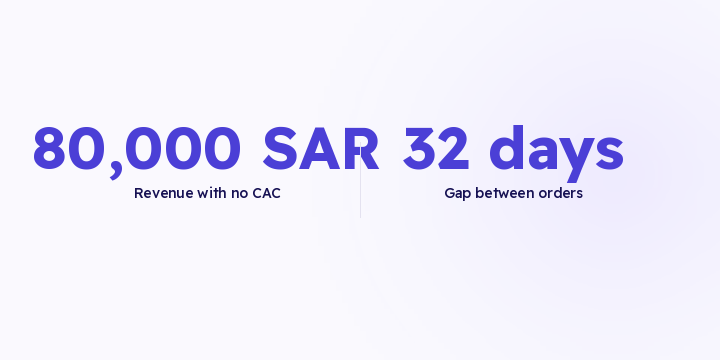
An illustrative quarter: 1,000 customers bought for the first time, and 200 of them came back for a second order. That's a 20% repeat rate, with an average gap of 32 days between the two orders. At a 400 SAR average order, those 200 customers are 80,000 SAR with no acquisition spend behind them.
Lift the rate to 25% with a campaign timed inside that gap and it becomes 100,000 SAR from the same customer base. That's the cheapest revenue available to your store, and it's produced by channels almost nobody measures.
A first purchase journey involves discovery: four or five touches, a broad channel that opens it, and a gap for thinking it over.
A second purchase journey usually doesn't. The customer already knows you, so the path is shorter and the touches differ in kind: an email, a message, a retargeting impression, a packaging insert that came with the first delivery. Because it's short and closes on something like direct or brand search, standard attribution credits the close and gives almost nothing to whatever brought the customer back.
The repeat rate describes where you stand, but the gap sets the timing of your campaign, and that's the part you can work on this week.
Most stores never compute the gap, so retention timing becomes guesswork, and a guess that's wrong in either direction wastes budget in its own way.
Repeat rate on resolved identity. Before identity resolution this number is wrong in a known direction, because a returning customer on a new device counts as new. See identity resolution.
The gap distribution, not the average. If most returns cluster at 20 days with a long tail, an average of 32 days describes almost nobody.
Repeat rate by acquisition channel. This is the number that moves acquisition budgets: a channel whose customers come back is worth more than its first-order return suggests.
In Flowfy, identity resolution, full order history per customer and touchpoint journeys inside a 90-day window are live, so the rate, the gap and the second journey are all readable today. Cohort retention curves and lifetime value by first acquisition channel are on the roadmap and haven't shipped. See nCAC and cohorts.
The channels that produce it are cheap and mostly unmeasured: email and messaging to existing customers, packaging inserts that reach someone who has already bought, and retargeting when it isn't spent on people who repurchased anyway. See QR inserts.
Tag the first three and they become rows with numbers. The fourth one, product quality and the delivery experience, is real and outside measurement, and it's better to say so than to pretend you're measuring it.
Pull last quarter's orders and compute two numbers: how many customers came back, and how many days sat between their first and second order. Then time your next retention campaign inside that gap instead of picking a date by feel, and compare the repeat rate after a full quarter.
Offline touchpoints cost you money and have no revenue line facing them. One code on something you already print turns them into a channel you can compare against paid.
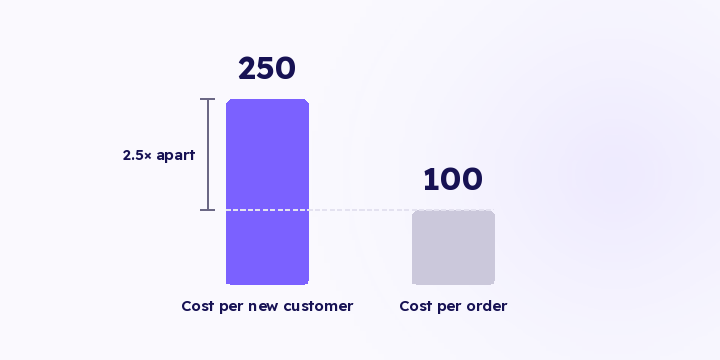
Spend divided by all orders flatters every campaign that resells to your own customers. Here's the arithmetic, and the order to work through to LTV by channel.
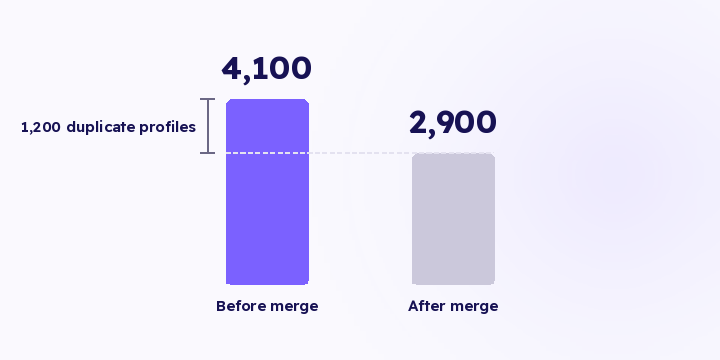
A phone visit and a laptop purchase are two separate records. Here's what merges them, why backfilled history changes your attribution, and what moves in your numbers afterwards.