

Seasons
What to freeze before a season, and what to keep changing
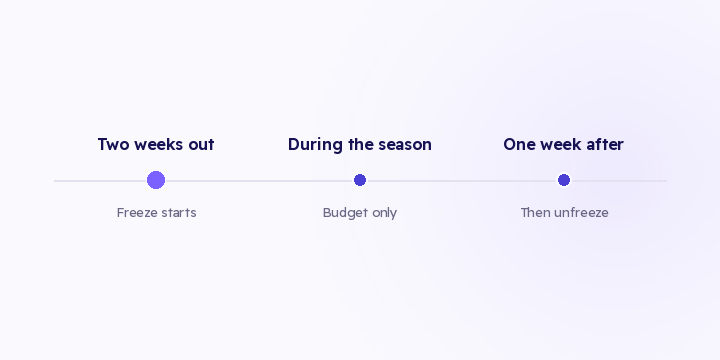
Most season damage comes from a change made during the season itself. Here are the parts you stop touching two weeks out, and the parts you keep adjusting every day.
3 min read
Every allocation decision you make in a season runs on incomplete information under time pressure. There's no getting around that. What you can avoid is making it on numbers the platforms produced about themselves.
Peak-night budget: 30,000 SAR, split by what the platforms reported.
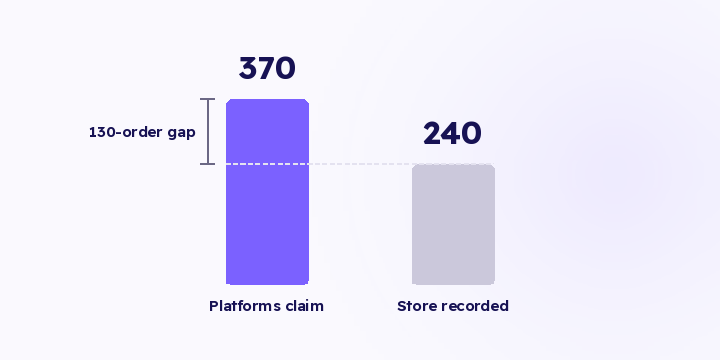
Together the platforms claim 370 orders. Your store recorded 240. Snapchat claims 120 of the 370, which is 32% of the credit, so 9,700 SAR of the night's budget.
Once you remove the duplication and attribute each order to its real source, Snapchat's share is 40 orders out of 240. That's 17%, or about 5,000 SAR.
The difference is 4,700 SAR in one night, on the channel you believed was carrying the season.
The problem isn't the 4,700. It's that the same decision repeats every day of the season, sometimes every few hours, and each repetition applies the same distortion.
To run this check yourself you only need two numbers: the total conversions the platforms claim for a given day, and your store's order count for that same day. If the platform total sits clearly above your order count, every share you're splitting budget on is inflated, and the most inflated one is usually the highest-volume channel.
Three effects stack up at the wrong moment:
An ordinary month hides all three because volume is low and steady. A season exposes them all at once.
That's the whole live routine. Anything longer than that stops happening once the pressure starts. Twice a day is enough for most stores, more if daily spend is high. The frequency matters less than the check happening while there are still days left to act on.
Revenue by source, attribution flow, trends and delivered conversions per destination are live in Flowfy today. Deduplication across the browser and server paths is live too, which is what makes the corrected share above possible.
Joining ad spend from the ad accounts is on the roadmap and hasn't shipped. So for now the second number is manual: put the spend figure from your ad accounts next to the revenue figure.
Two channels can sit at nearly the same ROAS today, one having fallen from 5.2 and the other having climbed from 1.4. In the table those two look interchangeable, but one is heading up and the other down, and that's what decides where the budget goes.
This matters more in a season than at any other time, because the level is inflated for everybody. Demand is up, so every channel looks better than it is, and the signal that still separates them is direction.
In practice: compare a channel to its own previous two days, not to whatever channel sits next to it in the table.
New versus returning, product splits, cohort behaviour, creative analysis. All of these are more accurate after the season, and none of them changes what you do this afternoon.
Try to read them mid-season and the two-minute routine becomes a forty-minute one. And a forty-minute routine goes unopened on the day it matters.
Open two numbers before you split tomorrow's budget: revenue by source from your own orders, and delivered conversions per destination. If a channel looks bad on day one, check its direction and whether its conversions are reaching the destination before you cut it. And fix your attribution model before the season and leave it alone, which is covered in what to freeze.
Most season damage comes from a change made during the season itself. Here are the parts you stop touching two weeks out, and the parts you keep adjusting every day.

Last 7 days, last 30 days, this month. All three were chosen for convenience, not for a question. Here's how to pick the range from the question you actually have.
Every tool defaults to previous period. That default answers a different question than the one in your head. Here are the three comparisons, and which one judges performance.