

Seasons
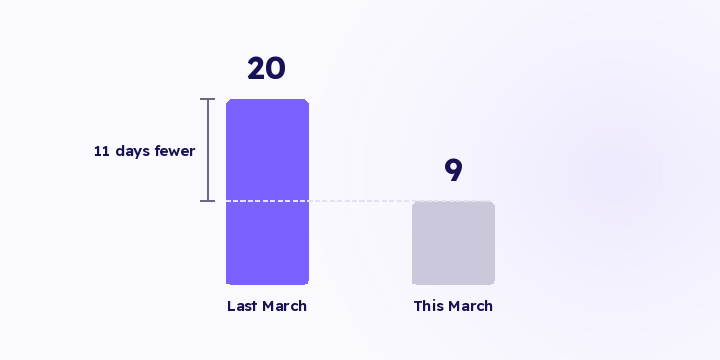
Ramadan moves 11 days a year and your comparison doesn't
Your report says revenue fell 22% year over year. Aligned properly, it rose 26%. Same data, from a comparison that matched dates instead of matching seasons.
2 min read
Week three of Ramadan just closed, and in front of you is the budget split for the final ten nights, the heaviest spending stretch of your year. What's on the dashboard is totals, and totals are the weakest evidence available for this particular decision.
| Week 1 | Week 2 | Week 3 | Total | |
|---|---|---|---|---|
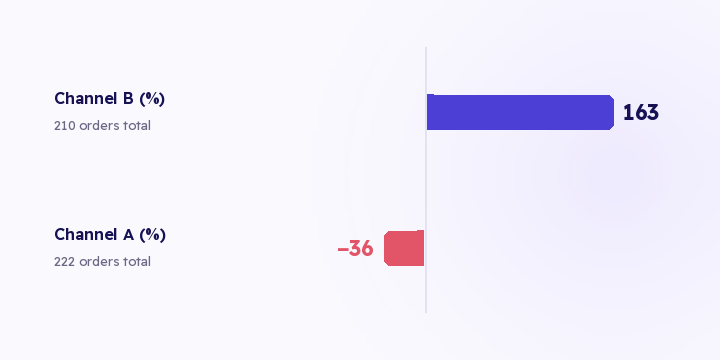
| Channel A | 90 | 74 | 58 | 222 |
| Channel B | 40 | 65 | 105 | 210 |
Read the totals and the two look interchangeable, 222 against 210. Any quick review says split the final-ten budget evenly between them.
Read the direction and the story inverts. A is falling by about a third, B has grown 2.6 times. And the decision isn't about the three weeks that happened, it's about the ten days ahead.
This matters more in a season than at any other time, because demand is elevated for everyone. The level is inflated across the board so it separates channels poorly, and the direction is what still carries information. A channel at 3.0 falling from 6.0 isn't the same channel as one at 3.0 climbing from 1.5, and the two are identical in the table.
Buying patterns reset when Ramadan starts. Categories that sold through Sha'ban can stop and others begin. Buying moves to late evening. Ad auction costs shift because everyone launches at the same time.
So week one is a transition, not a baseline. Three errors follow from treating it as one:
Not performance. Three things it reports reliably:
Attribution flow and trends are live in Flowfy, so direction per channel is readable across the season alongside revenue by source. Pulling ad spend from your ad accounts is on the roadmap and hasn't shipped, so the return figure behind a trend currently needs your spend from the ad accounts next to your revenue from Flowfy. The year-over-year Ramadan comparison is built by hand, and there's more on that in why the dates lie.
Rank your channels by slope rather than total, and move the final-ten budget on that basis. Rebalance weekly through the first two weeks and daily through the final ten, when one day is worth several ordinary ones.
Your report says revenue fell 22% year over year. Aligned properly, it rose 26%. Same data, from a comparison that matched dates instead of matching seasons.
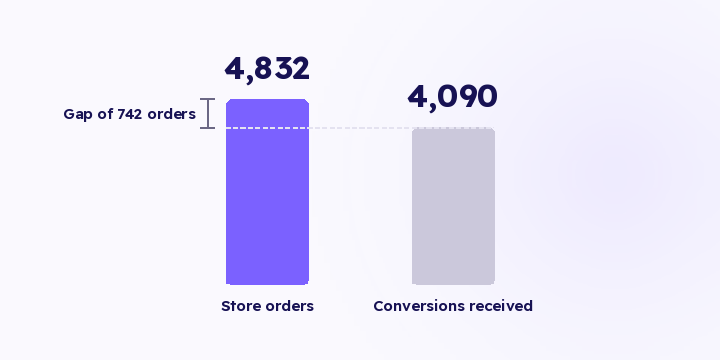
Tracking rarely fails in a way you can see. A theme update or a lapsed permission, and the numbers drift down and read as a slow week. Here's what to compare, how often, and how to tell when a gap is worth acting on.

Last 7 days, last 30 days, this month. All three were chosen for convenience, not for a question. Here's how to pick the range from the question you actually have.