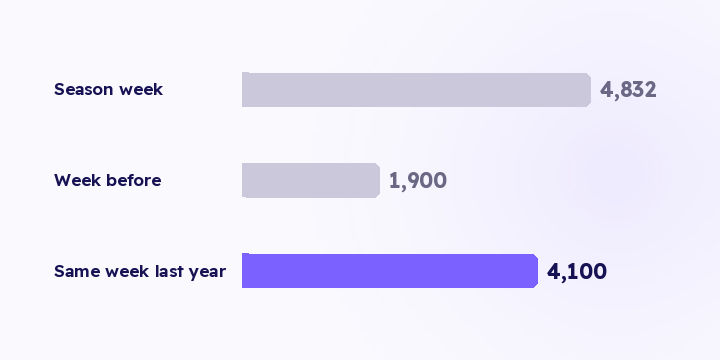
4,832 orders in a season week is a big number until you put it next to two others. One tells you a season happened. The other tells you whether you grew through it.
The season ends, the team is tired, and the readout becomes one number in a message: 4,832 orders. Nobody argues with it, because on its own the number doesn't tell you whether it's any good.
Against the previous week: roughly 2.5x. A nice-looking chart that says nothing about your work, because a season lifts everyone. You'd have seen a rise even if you'd done nothing.
Against the same week last year: 4,832 minus 4,100 is 732 orders, about 18% growth.
The first comparison tells you a season happened. The second tells you whether you grew through it. Reporting the first as an achievement is one of the most common measurement errors in seasonal commerce, and it's rarely deliberate. It's just the comparison that needs no setup.
Compare to the previous period to learn direction. Compare to last year to learn performance. The year-over-year comparison needs aligning by season day rather than calendar date, especially for seasons that move each year.
Did we grow, season over season? The number above, aligned by season.
Which channels produced it, and at what cost? Not blended. The split is the only part that changes next year's plan.
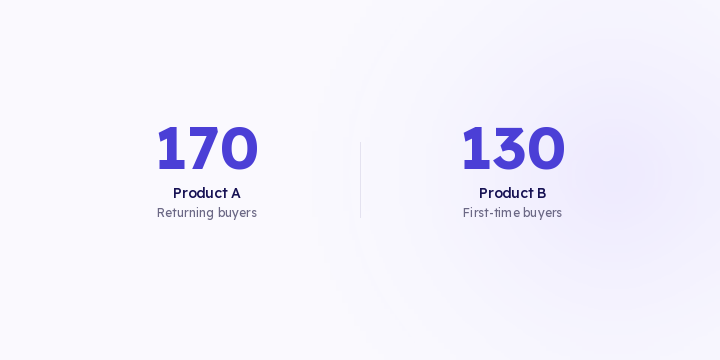
Did we buy new customers or discount to the ones we had? A season that sold to your existing base at a discount cost you margin and bought you nothing.
What happened in the four weeks after? This is the pull-forward test, and almost nobody asks it.
What broke, and when did we notice? Every season produces at least one measurement failure, and writing it down is what stops it recurring next year.
Question two takes the longest, because it needs revenue per channel from your own orders rather than from platform dashboards. Take the shares from the platforms and you'll add up to more than your total sales, then split next year's budget on a ranking that doesn't represent anything.
A discount season can move demand rather than create it. Customers who'd have bought in three weeks buy now, at a thinner margin.
Compare the four weeks after the season, this year against last. A season that created demand leaves the following month roughly normal. A season that pulled demand forward leaves a hole about the size of the spike, and part of the growth you reported was borrowed from the month after.
If growth came in at 18% but the following month dropped by something close to the spike, the question isn't how much you grew. It's what the discount cost you. This one comparison changes how you plan discount depth more than any in-season metric.
Wait until the four-week window after the season has closed. A readout produced two days after the season can't answer question four.
Revenue by source is live in Flowfy today, and new versus returning reads from resolved customer records. Period comparison, season shading against last year's equivalent season, joined ad spend and product-level splits are all on the roadmap and haven't shipped, and the last of those is covered in product decisions.
Until they do, you produce the readout by selecting both ranges yourself and pulling spend from your ad accounts. All five questions are answerable today; four of them take a spreadsheet.
The readout has a second job: it's the input to next year's preparation. Three lines are enough:
What broke, and how many days it took to notice
Which comparison baseline you used, so next year matches it
Which channel opened journeys and which closed them, since the season compresses that difference
Nobody remembers these details eleven months later, and everybody assumes they will.
If last year's data isn't reliable, say so in the readout and use it as direction only. A written caveat is worth more than a comparison everyone quietly distrusts.
Schedule the readout for four weeks after the season ends rather than two days after, so pull-forward shows up before you commit to a growth number. And before you judge the 18%, work out what it cost you in margin, which is covered in profit rather than return.
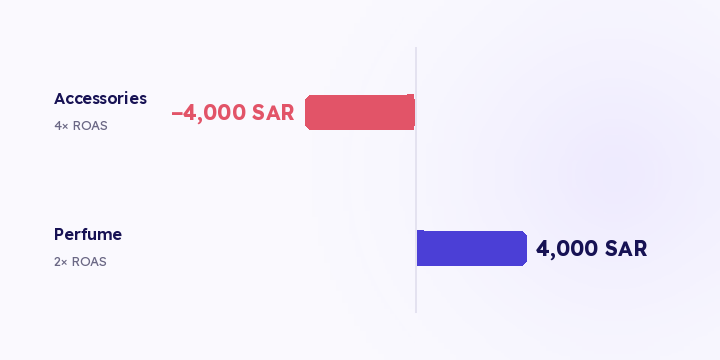
Budget is decided by channel. Stock, bundles and offers are decided by product. Two products with the same revenue can need opposite decisions, and revenue alone doesn't tell them apart.
ROAS counts sales, not profit. Once cost of goods, shipping and gateway fees are in, your campaign ranking changes. Here's the arithmetic and what to do about it.
Last 7 days, last 30 days, this month. All three were chosen for convenience, not for a question. Here's how to pick the range from the question you actually have.