When element-level analysis works and when it breaks
Grouping ads by a shared element grows the sample and shrinks the variance. But the method breaks in three situations. Here's the mechanism, the situations, and how to avoid them.
There's one idea behind element-level analysis: a single ad doesn't carry enough conversions to rank honestly, so you pool several ads that share an element and read the group instead.
The idea works, but it has conditions. Those conditions are worth knowing before you put a budget decision on top of them.
Any ad's performance is its true effect plus noise. With a small conversion count per ad, the noise is large relative to the effect, so ranking ads mostly ranks their randomness.
Pool several ads that share an element and two things happen at once: the sample grows, and part of the individual-ad noise cancels out. What survives is closer to the effect of the element itself. It's the same reason you don't judge a channel on a single day.
That one is fair. Below roughly eight to ten creatives in total, the groups get small and you've recreated the original problem with extra steps.
The practical floor is four or five ads per group. If you don't have that, pool two consecutive batches instead of splitting one, as long as both batches ran on the same audience.
This is the more dangerous one, because it doesn't show.
If all your face-opening ads are also the newest and the best produced, you aren't measuring the opening shot. You're measuring a blend of three things that shipped together.
Before you believe any result, check what else the ads in a group have in common besides the element you tagged. And if two elements point in opposite directions, they're probably tangled, so look for the shared factor between the groups.
The same problem shows up when placements or audiences differ between groups. An element tested on a different audience isn't a comparison. Hold constant whatever you can.
If one group received three times the spend, its ads may have saturated their audience while the other group's didn't. Compare returns at similar spend levels, or write the caveat next to the result.
Retrospective tagging is possible, and it's biased. You label ads knowing which ones performed, and the labels drift toward explaining the winners.
Specifying elements up front is better for two reasons. The tagging comes out honest, and you can produce a balanced set on purpose: four ads opening on a face and four on a product, same budget, same audience. That's a test. Twelve ads tagged afterwards is an observation. Both are useful, and only the first supports saying the element caused it.
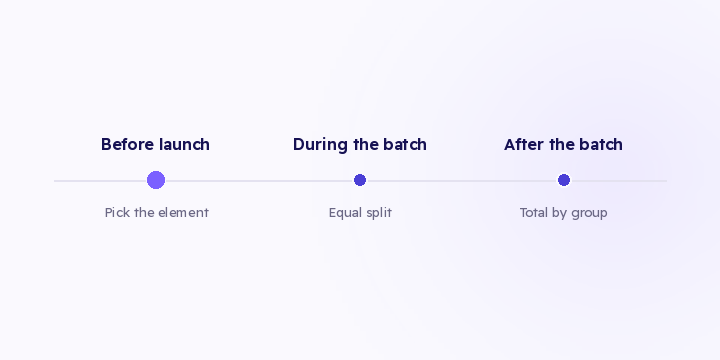
Before your next batch, pick one element, fix the tagging now, and split budget evenly between the two groups on the same audience. After the batch, total spend and revenue per group. Use your own attributed conversions rather than platform conversions, since platform numbers vary by window and overlap across platforms, which adds noise to the comparison you're trying to sharpen.
Order source down to the individual ad is live in Flowfy, so you can group revenue by whatever classification you apply. Automatic creative classification and an element-level view are on the roadmap and haven't shipped. Until they do, the classification is a manual column and the grouping happens in a spreadsheet.
Rerun this every creative cycle. Element effects erode as audiences see the pattern more, and what worked this quarter may not work next quarter.
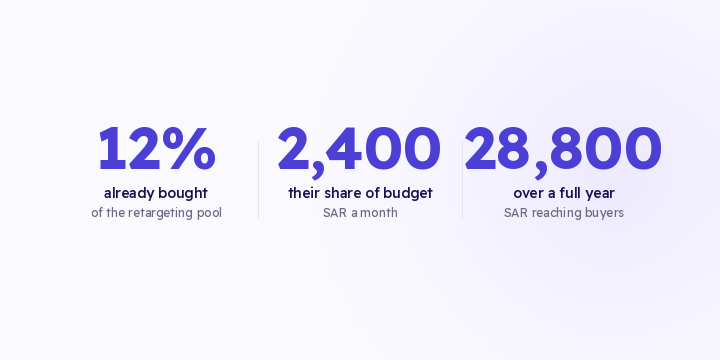
12% of a retargeting audience has already bought, and their share of the budget is 2,400 SAR a month. The waste never shows up as a loss anywhere, which is why it runs for years. Here's the arithmetic and the exclusions to run.
A blended repeat rate mixes a customer of three weeks with a customer of two years. Grouping people by when they arrived turns a static number into a curve you can act on. Here's the idea and three objections to it.
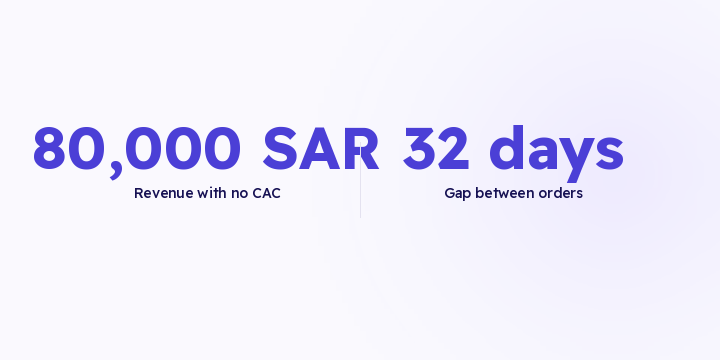
The second order has its own journey and its own channels, and it's the cheapest revenue you have. Here's the arithmetic, and the time gap that decides when to act.