

Profit
Join ad spend to orders on the click ID
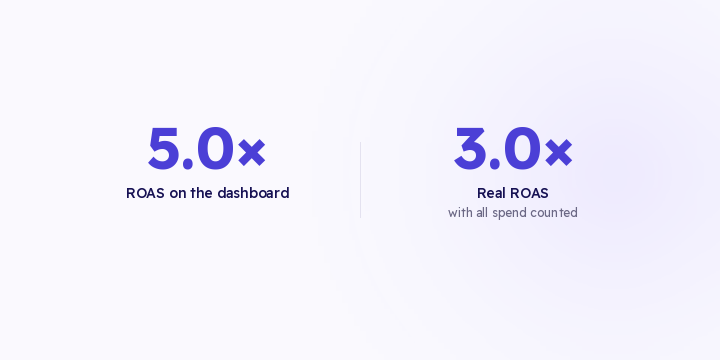
A 5.0 ROAS on the dashboard is worth checking before you celebrate. If 40% of your spend never matched a campaign, the denominator is short and the number is wrong in the direction you like.
3 min read
Attention goes to the top half of the division: revenue, orders, conversions.
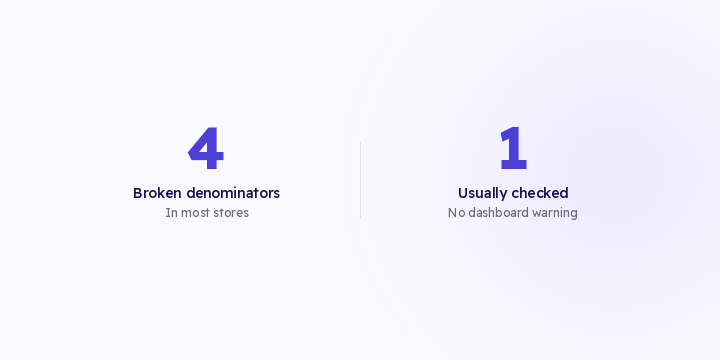
The denominator, the bottom half, decides whether any of those numbers means anything, and it's rarely examined. Four denominators are wrong in most stores, and each one moves a figure you make decisions on.
1. ROAS: spend that never matched. If 40% of your spend sits in an unknown bucket, the denominator is short and the number reads higher than reality. See joining ad spend.
2. Conversion rate: which sessions? Bot traffic inflates the session count, so conversion rate reads lower than reality. A blended rate across sources describes none of them. See funnel by source.
3. Cost per customer: which customers? Divide spend by orders and you get cost per order. Divide it by new customers and you get cost per new customer, which is often two to three times higher and is the figure acquisition decisions need. See nCAC.
4. Repeat rate: how many customers? Unresolved identity inflates the customer count, so repeat rate reads low. The same orders across 4,100 records instead of 2,900 give you 1.18 instead of 1.67. See identity resolution.
Three of the four make your numbers look worse than they are. One makes them look better.
A numerator is usually something you can count directly: orders, revenue. It has an obvious definition, and someone notices when it moves.
A denominator is usually a population, and a population needs a definition: which sessions, which customers, which spend, over which window. Each of those choices got made once by someone, often by leaving a default in place, and then everyone inherited it without asking.
For any efficiency figure you report regularly, write the denominator down explicitly:
| Metric | Denominator to state |
|---|---|
| ROAS | Total spend, or matched spend only? |
| Conversion rate | All sessions, or human sessions? |
| Cost per customer | Orders, or new customers? |
| Repeat rate | Raw records, or resolved identities? |
If two people on your team would answer any row differently, that metric isn't comparable between them, and it's probably been the subject of an argument neither of them realised was about a definition.
Of the four, the spend denominator is the dangerous one, because its error runs in the direction nobody questions.
If conversion rate reads low, someone opens an investigation. If return reads high, someone raises the budget. So before you act on a strong return figure, ask what share of spend is actually in the calculation.
In Flowfy, bot and non-human session classification is live, which fixes the second denominator. Identity resolution is live, which fixes the fourth. New versus returning is readable from resolved customer records, which supports the third. Joined ad spend is on the roadmap and hasn't shipped, so the first denominator is assembled from your ad accounts by hand today.
Size your unknown spend bucket: total spend reported by the platforms against spend you can attribute to named campaigns. The difference is the bucket, and it tells you how far your return figure sits from reality.
If there's a denominator you can't fix right now, state it every time you report the metric. A known-imperfect denominator everyone understands beats a silent one.
A 5.0 ROAS on the dashboard is worth checking before you celebrate. If 40% of your spend never matched a campaign, the denominator is short and the number is wrong in the direction you like.
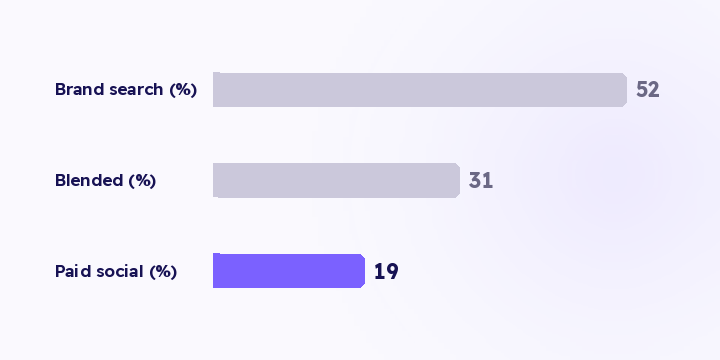
The blended number says your problem is checkout. Split by source and it says the problem sits in one kind of traffic, and the fix is a completely different one.
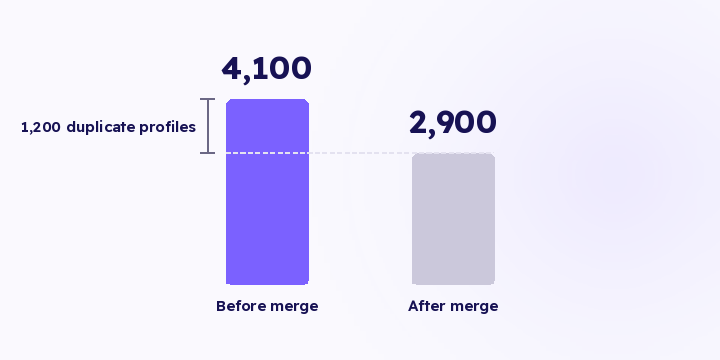
A phone visit and a laptop purchase are two separate records. Here's what merges them, why backfilled history changes your attribution, and what moves in your numbers afterwards.