

Analytics
Finding the widest gap in your funnel
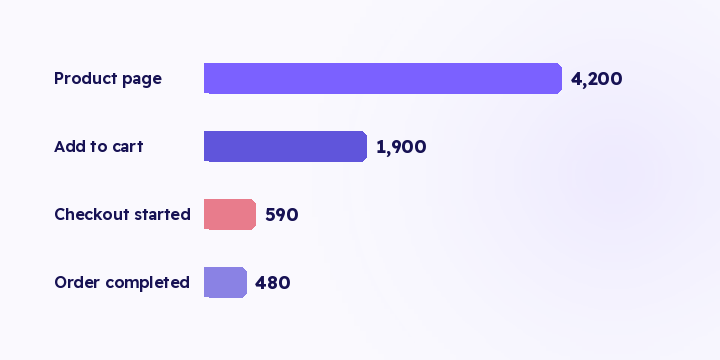
Most stores fix the step they have a ready number for, not the step losing them people. The rule is one line: compute the transition rate between each pair of steps and start at the lowest.
3 min read
A single funnel for your whole store describes an average visitor who doesn't exist.
Someone arriving from a brand search and someone arriving from a broad prospecting campaign are at different stages of deciding. Put them in one number and you hide both.
| Source | Visit → product | Product → cart | Cart → checkout |
|---|---|---|---|
| Brand search | 61% | 58% | 52% |
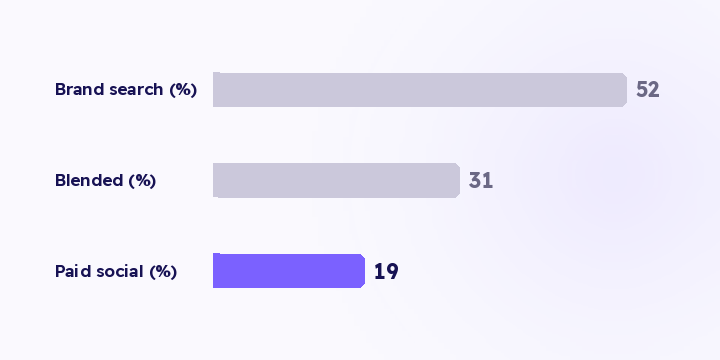
| Paid social prospecting | 38% | 41% | 19% |
| Influencer link | 44% | 63% | 24% |
| Blended | 42% | 45% | 31% |
Illustrative figures.
Three different shapes, and the blended row describes none of them.
Read the blended row and the weakest step is cart-to-checkout at 31%. The natural conclusion is that shipping cost, delivery time or payment options are the issue.
Read the same funnel by source and brand search clears that step at 52%. The problem is concentrated in paid social and influencer traffic.
That changes the diagnosis completely. Checkout works. What's happening is that colder traffic won't accept the shipping terms and warmer traffic will.
Page fixes touch everyone: shipping messaging, payment options, delivery estimates, page speed. Use them when the weak step is weak across every source.
Ad fixes touch one source: creative, targeting, the landing page, the promise the ad made and the page didn't keep. Use them when one source is weak on a step the others clear fine.
The distinction matters because different people do the two jobs at different costs. A store reading only the blended row sends an ad problem to the site team, and the edit lands in the wrong place.
Compare your sources against each other rather than against an external benchmark. Your brand search funnel is the best benchmark you have, because it shows what your pages can do when the traffic has already decided.
63% product-to-cart, the highest source in the table. Then 24% cart-to-checkout, close to the lowest.
That combination is specific. High intent at the product page and a collapse at the shipping step usually means the audience is enthusiastic but sensitive to the total, or concentrated in a region where your shipping terms are weak. Neither shows up in a blended funnel, and neither gets fixed by redesigning checkout.
Event coverage per source. Order-level source is live in Flowfy, so orders and revenue split by source reliably. Pre-purchase events, product views and add-to-cart, are collected in the browser and their coverage depends on your theme. A heavily customised template can drop a step entirely, so you read it as weak when it's actually missing. More on reading these in funnel drop-off.
Volume per source. A source with 200 visits produces percentages that swing on a handful of people. Read it monthly, or not at all.
Whether the source is really one source. "Paid social" covering four campaigns with different audiences and creative is another blend, one level down. Split until the rows behave consistently.
Split your funnel across the four or five sources that carry most of your traffic and find where the weakest step sits in each row. If the weakness is in one source, start with the ad and the landing page. If it's in all of them, it's a page or shipping-policy problem and a general fix is the right response.
Then revisit your campaign targets. A prospecting campaign judged against your blended conversion rate is being judged against traffic that had already decided before it arrived.
Most stores fix the step they have a ready number for, not the step losing them people. The rule is one line: compute the transition rate between each pair of steps and start at the lowest.
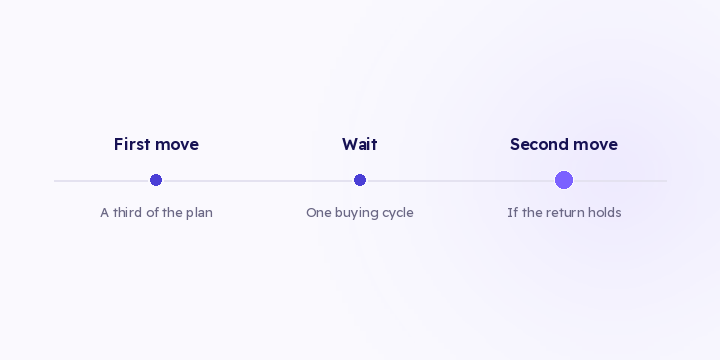
The distribution check tells you there's an opportunity. Moving it all at once eats most of it. Here are three execution rules, and what to watch afterwards.
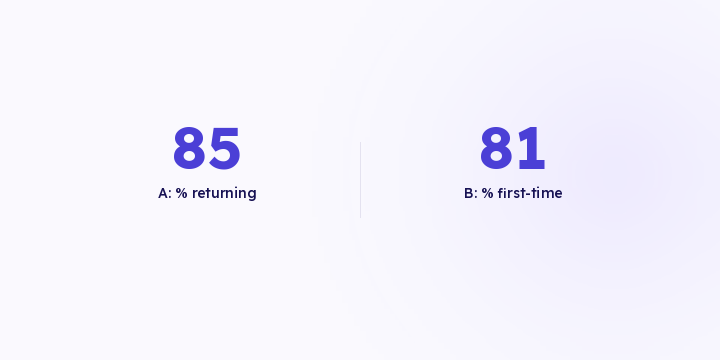
Two products with the same revenue can need opposite budgets. One buys you new customers, the other is why they come back. Revenue alone doesn't tell them apart.