

Analytics
How to move budget between channels without losing the gain
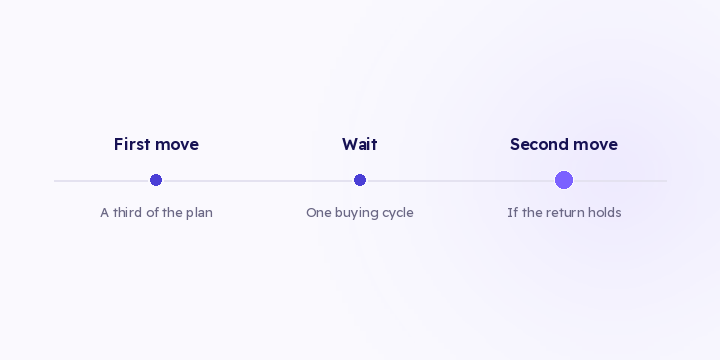
The distribution check tells you there's an opportunity. Moving it all at once eats most of it. Here are three execution rules, and what to watch afterwards.
2 min read
You open the dashboard in the morning and a channel shows 40 orders. The number is correct and it doesn't help, because it says nothing about what you spent to get them.
Once every order carries its source, your question changes from "what happened yesterday" to "where does the next riyal go". Three views answer that, and each one covers a different blind spot.
The screen you open every morning needs three things together:
What matters is that the revenue side is attributed on your side rather than taken from each platform's own account of itself. Add up platform numbers and you'll find three platforms each claiming the same order, which gives you a total larger than everything your store sold.
Then read the trend before the number. A channel at 3.0 falling from 6.0 isn't the same as a channel at 3.0 climbing from 1.5. They match in the table and they call for opposite decisions.
Visit, product, cart, checkout, order. Your customer stops at one of those steps.
The common mistake is treating the step you happen to have a number for. A merchant sees the abandoned cart figure and builds a whole plan on it: recovery emails, a coupon, a WhatsApp reminder. A month later the result is thin, because the cart wasn't where the loss was.
Work out the transition rate between each pair of steps, and start with the lowest one.
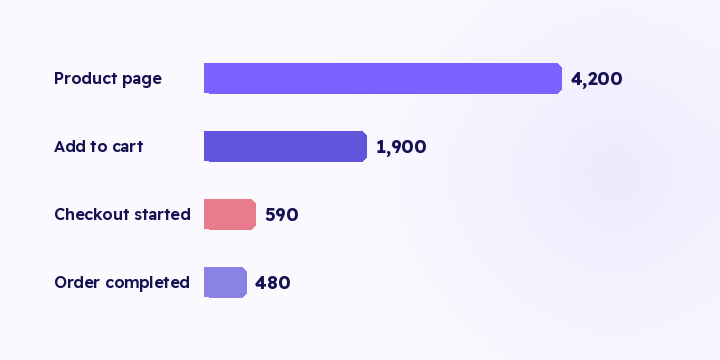
| Step | Count | Transition |
|---|---|---|
| Product page | 4,200 | 42% of visits |
| Add to cart | 1,900 | 45% of product viewers |
| Checkout started | 590 | 31% of carts |
| Order completed | 480 | 81% of checkouts started |
Illustrative funnel on 10,000 visits.
The weakest step is that 31%, which is 1,310 people lost in a single transition. Compare two fixes:
Then read the same funnel by source. Visitors from search reach checkout and finish, one campaign opens the product page and leaves, traffic from a creator hesitates at shipping. Same steps, very different shapes. If the weakness shows across every source, fix the page. If it belongs to one source, fix the ad.
And before any of it: raising spend on a broken funnel makes the problem bigger, not smaller.
A single average mixes the person who bought once with the person who came back four times, and describes neither.
| Group | Customers | Orders |
|---|---|---|
| Bought once | 2,000 | 2,000 |
| Bought twice | 800 | 1,600 |
| Bought four times | 308 | 1,232 |
Illustrative distribution across 4,832 orders in 90 days.
Those 308 are 10% of customers and 25% of orders. Sort them by the channel that brought them in. If most came from one channel, that channel is worth more than its first-order return suggests, and its budget deserves another look.
You can stack the filters, which turns the question commercial rather than technical: customers who arrived from TikTok in the last 60 days and have spent more than 500 SAR. Flowfy ties each customer to their source and to every order after it, so you can pull that list and work it.
Why not just use the ad platform dashboard? You need it for optimising inside the platform. But splitting budget between channels can't rest on four sources each describing itself.
What's a good conversion rate? Your own trend and your split by source are more useful than any general benchmark. A blended rate hides the fact that one source converts fine and another doesn't.
Do I need spend connected for these views to work? Orders, revenue and the funnel work without it. Return and new customer cost need it, and without spend the dashboard shows half the equation and leaves you to guess the rest.
Start with the funnel. Work out the transition rate between each pair of steps and take the lowest. Two weeks after you fix it, go back to the channel view and see whether your spend ranking has moved.
The distribution check tells you there's an opportunity. Moving it all at once eats most of it. Here are three execution rules, and what to watch afterwards.
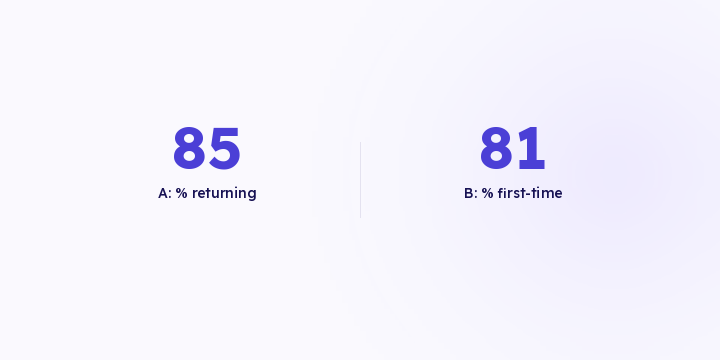
Two products with the same revenue can need opposite budgets. One buys you new customers, the other is why they come back. Revenue alone doesn't tell them apart.
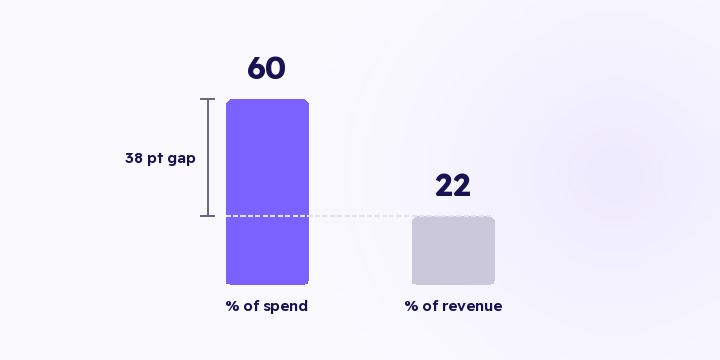
Tracking is fine and the money is going to the wrong place. That's the more common case, and it doesn't surface as an error anywhere. Here's the check, with the arithmetic.