The budget split check, and three other commercial checks
Tracking is fine and the money is going to the wrong place. That's the more common case, and it doesn't surface as an error anywhere. Here's the check, with the arithmetic.
Most alerting conversations are about outages. But a store loses more on correct decisions nobody reviewed than on broken tracking, and that kind of loss doesn't surface as an error of any kind. Every campaign delivers, every number looks reasonable, and spend runs exactly as configured.
Monthly spend is 50,000 SAR. Revenue is 128,450 SAR.
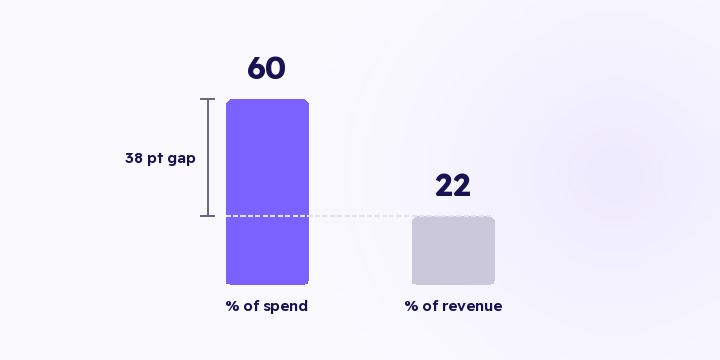
Channel A takes 60% of spend = 30,000 SAR and returns 22% of revenue = 28,259 SAR. That's 0.94×
Channel B takes 40% = 20,000 SAR and returns 78% = 100,191 SAR. That's 5.0×
The check suggests moving 10,000 SAR from A to B. If B holds its return, that's 50,000 SAR of additional revenue against 9,400 SAR you give up on A.
This is a different thing from ranking channels on a dashboard. A ranking tells you which channel beats which. This calculation tells you how many riyals are sitting in the wrong place and what changes if you move them. Treat the result as a sizing tool rather than a forecast, because returns don't hold flat as spend scales.
Alert rules inside ad platforms run on that platform's own conversions, which are exactly the numbers in question. The platform counts a conversion by its own attribution window, and it can claim orders another platform is also claiming.
So the calculation has to start from your store's orders. Otherwise it's a platform telling you it's doing well.
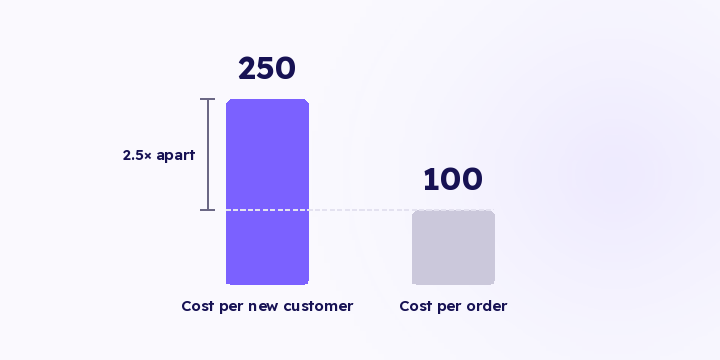
New-customer cost spike. Cost per new customer rising more than a percentage you set, week over week. Note that it's per new customer, not per order. A blended cost per order can improve while new-customer cost deteriorates, and that combination is the one worth catching. See nCAC.
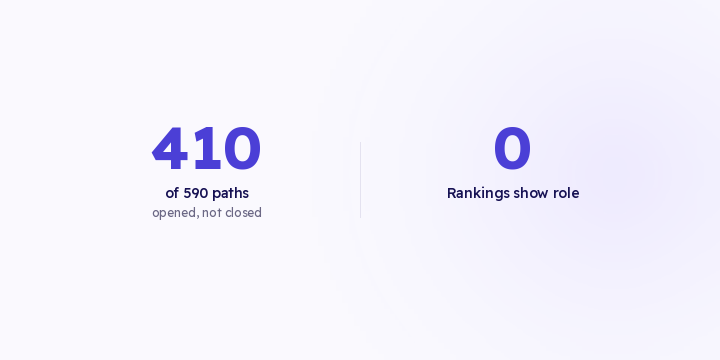
Channel return collapse. A sharp drop against that channel's own recent baseline, not against a fixed figure. If a channel's job is opening the path rather than closing it, set its expectation explicitly, or it'll raise a false alarm every week. See designing the sequence.
Margin drift. Revenue flat, profit falling. Usually a mix shift toward lower-margin products or payment methods, and it's invisible in any revenue-based metric.
A tracking break gets caught by a report eventually, because something has stopped. Nothing has stopped in a bad budget split.
So you reach month end, pull the report together, and find that 60% of budget went to a channel that returned 22% of revenue. That wasn't a wrong decision. It was a correct decision nobody reviewed, running for thirty days.
In Flowfy, revenue by source, attribution trends and customer records that separate new from returning are live, so all four checks can be computed today. Automated commercial detectors are on the roadmap and haven't shipped, and so is ad spend ingestion, which three of the four need.
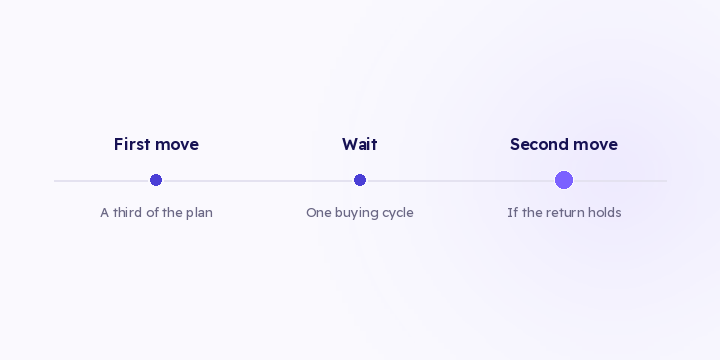
Open a spreadsheet and give each channel two columns: its share of spend, and its share of revenue based on your store's orders. The channel whose spend share is clearly larger than its revenue share is where you start. Move a small part first, and watch for two weeks before moving more.
Ranking channels best to worst assumes they all do the same job. The alternative is assigning roles. Here's how to read each channel's role from your own data, and what changes in the budget afterwards.
Spend divided by all orders flatters every campaign that resells to your own customers. Here's the arithmetic, and the order to work through to LTV by channel.
The distribution check tells you there's an opportunity. Moving it all at once eats most of it. Here are three execution rules, and what to watch afterwards.