

Seasons
Reading the first week of Ramadan
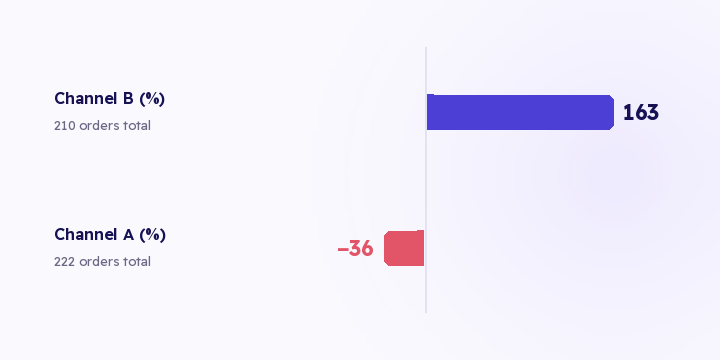
Two channels with near-identical totals after three weeks. One is down a third, the other has more than doubled. The total says split evenly, the trend says move the whole budget.
2 min read
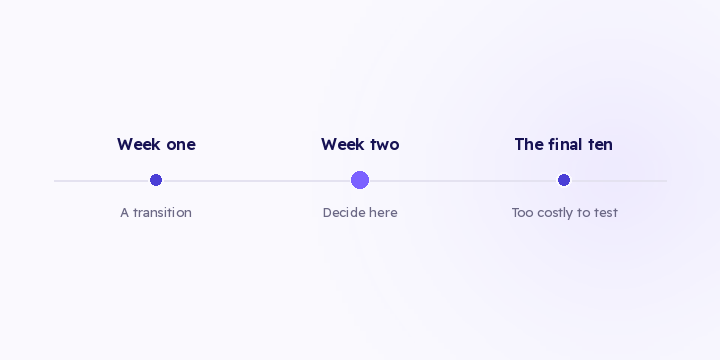
Week one of Ramadan is a transition and its numbers can't be judged. The final ten nights are too expensive to experiment in. That leaves week two: the only part of the month where the data is readable and the decision still has runway ahead of it.
By week two, three things have settled. The daypart shift has stabilised, prospecting campaigns have exited learning, and the category mix for this Ramadan is visible.
By week three the final ten are close enough that a change made now lands mostly inside the most expensive stretch of your year. That's the worst place to be running a change you haven't validated.
Reallocate on direction, not level. A channel falling from 6.0 to 3.1 and one climbing from 1.4 to 3.0 sit next to each other in the same table and need opposite decisions. Move spend toward the rising slope, before the final ten rather than during them. More in reading the first week.
Fix the widest funnel gap, if the fix is cheap. Mid-season traffic is at its highest, so a conversion improvement compounds over the remaining days at maximum volume. Only take it if the fix is genuinely cheap and reversible: a shipping message, a payment option, a stock issue on a page. Not a redesign.
An across-the-board budget increase isn't a third move. It spends more on the falling channel too.
Tracking configuration is one of the most common causes of measurement failure mid-Ramadan, and no version of that change is worth the risk right now. Your attribution model is the same story: switch it today and the season stops being comparable to any other, including next Ramadan. Renaming products or changing catalogue structure breaks catalogue matching on every destination at once.
The test is simple. Anything you can't reverse in a day doesn't belong in week two.
One week of data isn't enough. It isn't excellent, that's true. But the question isn't whether the data is perfect, it's when the decision still has time to work. A store spending 6,000 SAR a day that finds a misallocation in week two can act on roughly twenty remaining days.
Better to wait for the readout. The same finding in the readout acts on next year: eleven months later, in a season that will have moved eleven days, with a team remembering the details differently.
While we're in here, let's review everything. The window is narrow, and a full review ends as a report nobody acts on. Five lines are enough: direction per channel over the last ten days, conversions delivered per destination, pace against target, the single widest funnel gap, and exclusion audiences.
If nothing looks clearly wrong, change nothing and spend the time verifying delivery instead. A quiet week two is a good outcome, not a failure to find something.
In Flowfy, attribution trends, revenue by source, conversions delivered per destination and funnel drop-off are live today, along with audience building and export. Goal pace tracking and joined ad spend haven't shipped, so the pace calculation and the return figures still need a spreadsheet alongside.
Two channels with near-identical totals after three weeks. One is down a third, the other has more than doubled. The total says split evenly, the trend says move the whole budget.

Last 7 days, last 30 days, this month. All three were chosen for convenience, not for a question. Here's how to pick the range from the question you actually have.
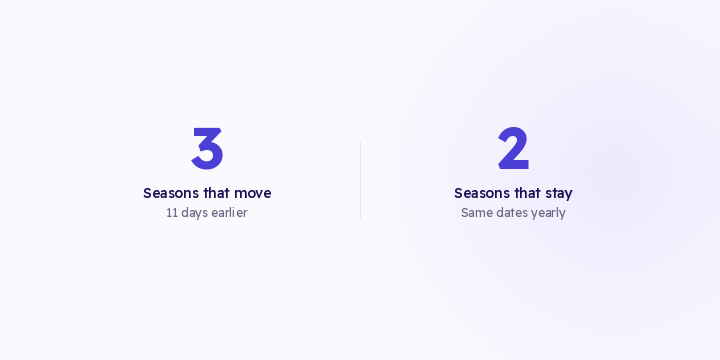
Every tool defaults to previous period. That default answers a different question than the one in your head. Here are the three comparisons, and which one judges performance.