

Growth
Your cost per customer is wrong if it counts returning buyers
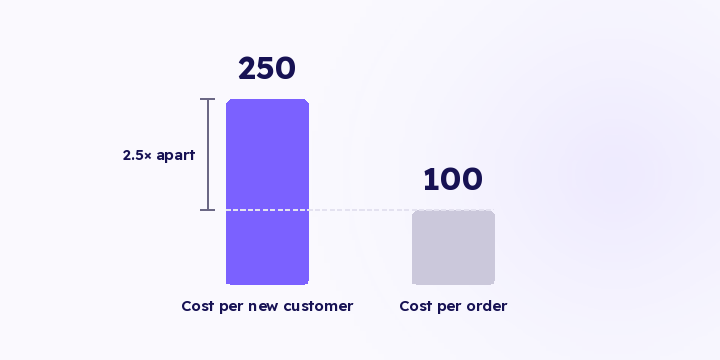
Spend divided by all orders flatters every campaign that resells to your own customers. Here's the arithmetic, and the order to work through to LTV by channel.
3 min read
National Day week moves fast. Spend rises, creators post, discount codes go around. Then the week ends, you open the reports, and you ask who brought what.
The question isn't hard. The hard part is that you're asking it after the window to act on it has closed.
An ordinary month tolerates a weekly rhythm. You see Monday's number, adjust on Wednesday, and lose very little. Four days don't give you that room, for three reasons:
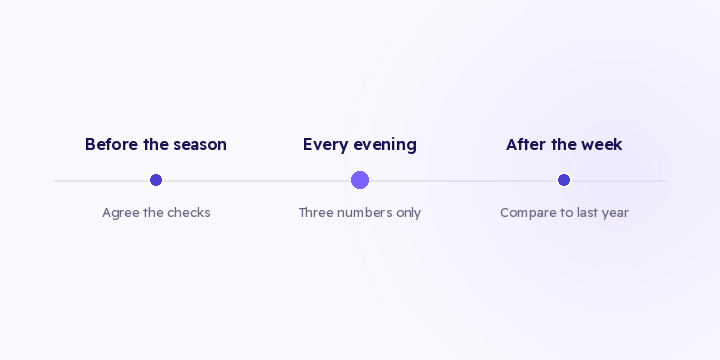
An evening check is enough for most stores, as long as it covers these three:
Everything else can wait for the readout. Order-level source and channel performance update in Flowfy as orders arrive, so the check happens on one screen instead of across three dashboards.
The check on its own isn't enough. Decide before the season what you do when a number moves: if a channel sits below break-even two nights running, do you cut its budget by an agreed percentage or pause it? If tracking stops, who calls whom? Those calls take a minute when they're written down in advance and a full day when the discussion starts mid-season.
7.4× across the week is a fine headline. As an instruction it says nothing, because it's an average over channels that behaved nothing alike.
In most strong seasonal weeks there's one channel carrying the result and one spending with nothing to show. The blended figure is high enough that neither gets opened until the week is done. What you need is the split: what each channel spent and what it returned, day by day.
Seasons widen the spread between channels sharply. Creator posts spike and stop, retargeting pools saturate faster because frequency is higher, and prospecting costs rise because everyone is bidding on the same days. A channel that held steady all month can move twice in four days.
Every seasonal campaign leans on codes, and a code counts the people who remembered to type it. That gap widens during a season, because shoppers compare stores quickly and type fewer codes than usual.
If you settle with creators on codes, you'll underpay the creator who actually moved buyers and overpay the one whose audience is diligent about typing. The alternative is a tagged link per creator, with the source stored on the order itself. Flowfy captures the source from a tagged link and holds it on the order; a per-creator link manager is on the roadmap and hasn't shipped, so today you build the links yourself.
Compare against last year's National Day, not against last week. A previous-period comparison only tells you a season happened.
Bring three numbers from last year for the same days: revenue by source, order count, and the share of new customers. If revenue grew and orders held flat, you sold at higher prices rather than to more people. If orders grew and the new-customer share fell, the season was a discount to buyers you already had.
Season shading and saved period comparisons are on the roadmap and haven't shipped. Until they do, you pick both ranges yourself and compare them manually.
So once the week ends, read the result against last year's National Day, and start with new-customer cost before blended return. More on that in new customer acquisition cost. The evening check on three numbers belongs a week earlier, with one person named to run it.
Spend divided by all orders flatters every campaign that resells to your own customers. Here's the arithmetic, and the order to work through to LTV by channel.

Last 7 days, last 30 days, this month. All three were chosen for convenience, not for a question. Here's how to pick the range from the question you actually have.
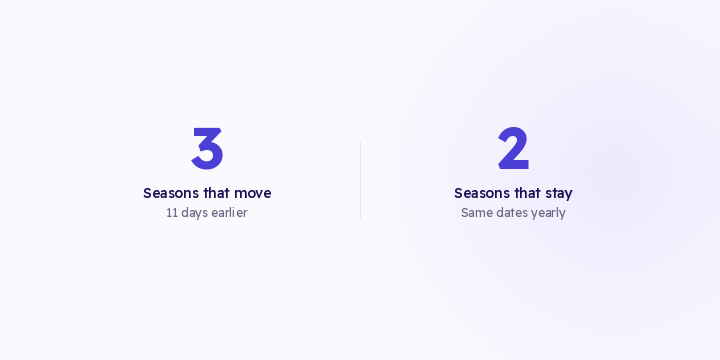
Every tool defaults to previous period. That default answers a different question than the one in your head. Here are the three comparisons, and which one judges performance.