

Analytics
How to move budget between channels without losing the gain
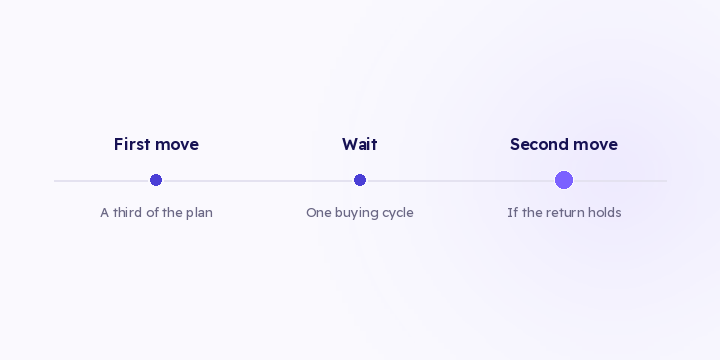
The distribution check tells you there's an opportunity. Moving it all at once eats most of it. Here are three execution rules, and what to watch afterwards.
2 min read
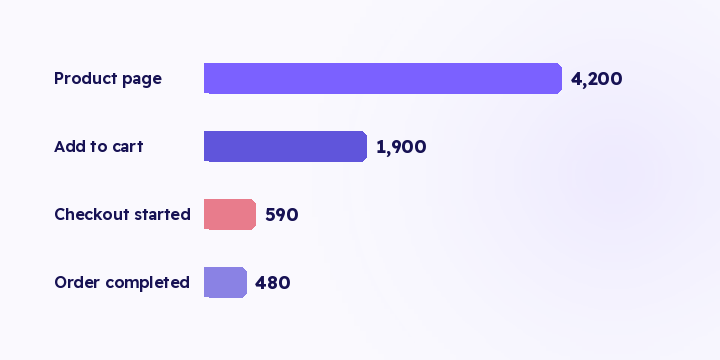
Visit, product, cart, checkout, order. Your customer stops at one of these, and the step they stop at is rarely the one you have a ready-made number for.
An illustrative funnel on 10,000 visits a month:
| Step | Count | Transition rate |
|---|---|---|
| Product page | 4,200 | 42% of visits |
| Add to cart | 1,900 | 45% of product viewers |
| Checkout started | 590 | 31% of carts |
| Order completed | 480 | 81% of checkouts started |
The figure that matters isn't the size of a step, it's the rate at which people move to the next one. The weakest transition here is 31%, which is 1,310 people lost in a single move.
It's similar effort either way. The difference is that you worked on the widest gap rather than the nearest one.
Abandoned cart count is the number every platform shows plainly, so it's the number the merchant has. A plan gets built on it: recovery messages, a coupon, a WhatsApp reminder. A month later the result is thin, because the cart wasn't where the loss happened.
Between "added to cart" and "started checkout" sits the moment shipping cost appears, the moment delivery time appears, and the moment payment options appear. Those are the three most common causes of a weak 31%, and a reminder message fixes none of them.
Search traffic reaches checkout and finishes. One campaign opens the product and leaves. Influencer traffic hesitates at shipping. Same steps, completely different shapes.
That changes the fix. General optimisation edits the page; optimisation by source edits the ad. If traffic from one campaign bounces off the product page while everyone else converts, the mismatch is between what the ad promised and what the page shows, and there's no page edit that repairs it.
Funnel drop-off is partly available in Flowfy today. Order and checkout events are captured reliably, while coverage of pre-purchase events like product view and add-to-cart depends on your theme, since they fire from the browser. A heavily customised theme can drop them, and that shows up as a funnel missing its middle steps. Confirm your event coverage before drawing conclusions from a step that looks unusually weak.
What's a good conversion rate? Your own trend and your own split by source are more useful than any general benchmark. A blended benchmark hides the fact that one source converts fine and another doesn't.
How do I tell a missing event from a weak step? Compare against your store platform's counts. A step sitting near zero is usually a tracking gap rather than customer behaviour.
Fix the funnel or buy more traffic? Spending more on a broken funnel doesn't fix it, it just makes the problem bigger. Every extra visitor meets the same 31%, so you pay for people who leave at the same rate as people who buy.
Compute the transition rate between each pair of steps in your funnel this week, and start at the lowest. Once you've made a change, read that same step by source before judging the result, because a weak step can be weak for one source only.
The distribution check tells you there's an opportunity. Moving it all at once eats most of it. Here are three execution rules, and what to watch afterwards.
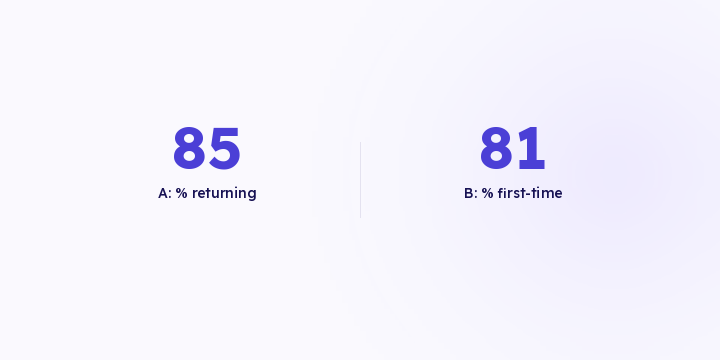
Two products with the same revenue can need opposite budgets. One buys you new customers, the other is why they come back. Revenue alone doesn't tell them apart.
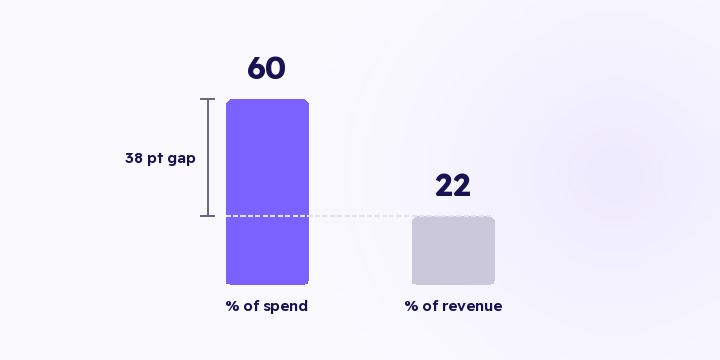
Tracking is fine and the money is going to the wrong place. That's the more common case, and it doesn't surface as an error anywhere. Here's the check, with the arithmetic.