

Attribution
Linear, time decay and position-based on one order
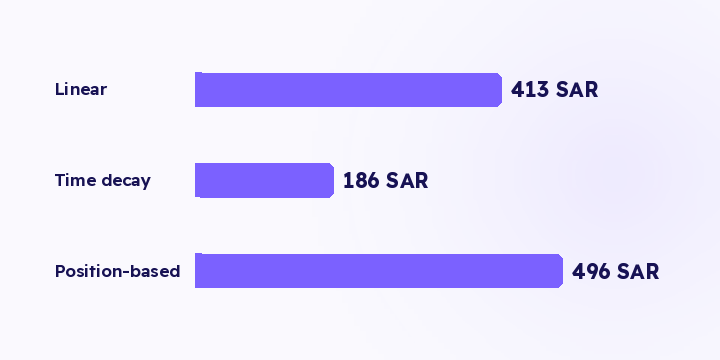
Three ways to divide credit across a journey instead of handing it to one touch. Take a single order, watch it split under each, and see which assumption fits your store.
2 min read
Most attribution arguments come down to one question: which model is correct. But first touch and last touch aren't measuring the same thing, so neither one is the answer to that question. A store reading only one of them is missing half the picture, in a direction you can predict.
Last touch answers: what closed the sale. It credits the final interaction before the order. It's the default in most tools because it's the cheapest to compute and the hardest to argue with, since the touch is sitting right next to the purchase.
First touch answers a different question: what started the relationship. It credits the interaction that produced the very first visit, however long ago, as long as it falls inside your attribution window.
Neither one measures a channel's value. Both measure its position in the journey.
Last touch over-credits whatever sits closest to the purchase: retargeting, brand search, email, direct visits. Those channels mostly harvest demand rather than create it. A store optimising on last touch keeps adding budget to harvesting until there's nothing left to harvest. The decline doesn't show up in the report.
First touch over-credits the top of the funnel: broad prospecting, awareness video, creator content. It ignores that plenty of first touches lead nowhere, and it tells you nothing about what converted.
Both errors run in a known direction, which is what makes reading them together useful.
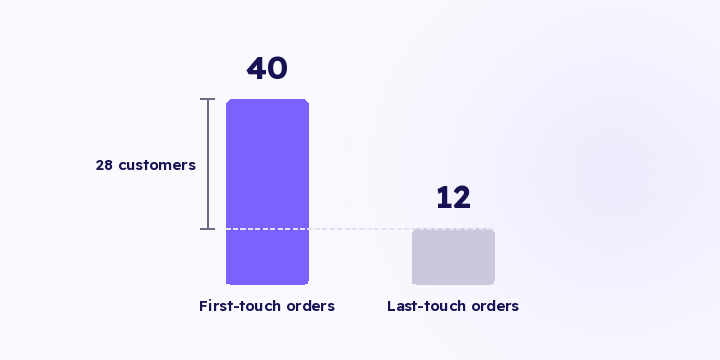
A campaign at 0.8× on last touch and 2.67× on first touch isn't a contradiction. Both numbers describe the same thing: 28 customers came in through that campaign and bought later, after a branded search or a direct visit. You only see it when you put the two columns side by side.
| Pattern | Reading | What to do |
|---|---|---|
| First much higher than last | The channel opens, something else closes | Don't judge it on close rate |
| Last much higher than first | The channel harvests existing demand | Don't scale it to grow |
| The two are close | Single-touch journeys | Model choice barely matters |
The third row is worth attention. In many stores a large share of orders have exactly one touch, and every model agrees on those.
With a 7-day window, a customer who takes 40 days to decide has their opening touch erased. Awareness campaigns, creator links and slow-working content all read as zero, not because they failed but because the tool can't see far enough back.
A model can only work with the touches inside your window. So before arguing about first versus last, check how far back your window reaches. Flowfy runs a 90-day window over stored journeys, so you can read the same period under either model without re-collecting anything. And if you want one number instead of two readings, there are multi-touch models.
Read your campaigns under both models over the same period and write down the difference per channel. Where first touch is much higher, don't cut on last-touch numbers.
Three ways to divide credit across a journey instead of handing it to one touch. Take a single order, watch it split under each, and see which assumption fits your store.
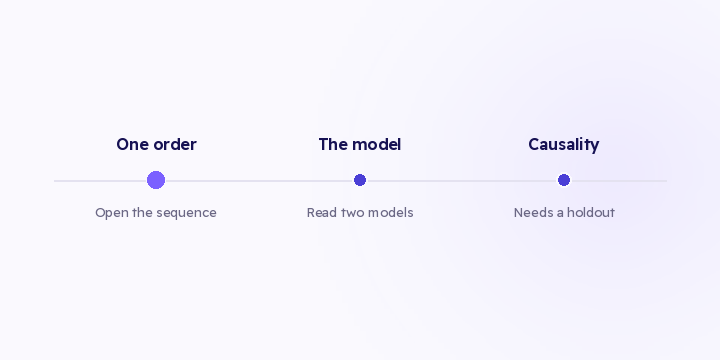
Most arguments about channel performance aren't arguments about data. Identify the type first, because only one of the three is settled by opening a record.
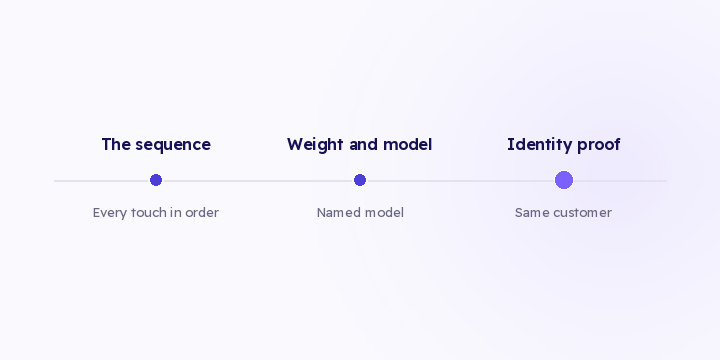
An 890 SAR order credited to a channel you didn't spend on this month. If you can't explain why, that number dies and takes every other figure from the same source with it.