

Analytics
Four checks before you act on a trend
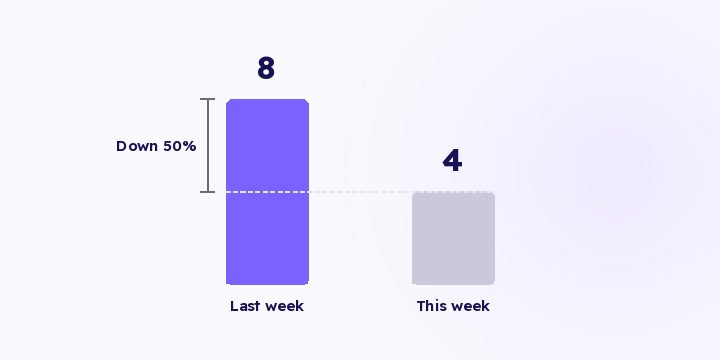
A channel dropped this week. Before you move its budget, there are four things to confirm, because ordinary variance and broken tracking draw the same line on a chart.
3 min read
Most dashboards get built by addition. Every request from the team earns a new widget, nothing is ever removed, and within a year the screen shows forty numbers and answers no question.
The screen you open every morning should be built by subtraction. It has one job: tell you where the next riyal goes.
1. Orders, revenue and conversion rate per channel, computed from your own store events rather than from what each platform claims about itself.
2. Spend, pulled from the ad accounts and sitting beside that revenue.
3. Return and cost per customer per channel, on one shared basis.
That's the whole screen. A dashboard that tells you a channel produced 40 orders without telling you what it cost gives you half the equation, and half an equation can't support a budget decision.
The orders, revenue and conversion rate views do work without spend, but return and cost per customer need it. Without spend you read half the picture and estimate the rest.
On the first item specifically, revenue has to be credited by your own attribution so that the top and bottom of the ratio are measured the same way. This is where most dashboards go wrong: they place your store's revenue next to conversions the platform claims, or they add up conversions from platforms that are each claiming the same orders. See counting every order once.
In Flowfy, orders, revenue and conversion rate per channel from your own store events, attribution flow and trends are live. Joining ad spend from the ad accounts is on the roadmap and hasn't shipped, so items two and three currently need the spend figure from your ad accounts. See joining ad spend.
For optimising inside one platform, use it. It sits closest to the auction and sees detail you can't get from outside.
For splitting budget between platforms, you're looking at four sources each describing itself, on its own window and its own rules. None of them knows how many orders actually reached your store.
Useful, yes. Daily, no. Three groups belong on a different screen:
Anything you check monthly. Cohorts, lifetime value, product mix. Real analysis, wrong screen. Putting it here means scrolling past it 300 times a year.
Anything with no action attached. Total sessions, bounce rate, page views.
Anything that needs interpretation. Attribution model comparisons, funnel diagnostics, path analysis. These reward attention, and attention is exactly what a two-minute morning check doesn't have.
The test is simple: if seeing the number wouldn't change what you do today, it doesn't belong on today's screen.
That doesn't mean everyone sees the same screen. The person buying media needs channel and spend. The owner needs revenue and pace against target. Same data, different subtraction.
Here the objection is partly fair, and there's one addition that earns its place: direction alongside level.
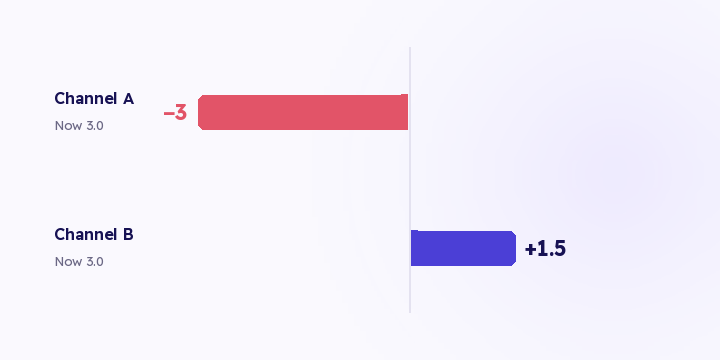
A channel at 3.0 falling from 6.0 is not the same channel as one at 3.0 climbing from 1.5. They're identical in a table and lead to opposite decisions. That's the one piece of interpretation worth keeping on a daily screen, because without it the screen misleads you. See when a trend is real.
A channel dropped this week. Before you move its budget, there are four things to confirm, because ordinary variance and broken tracking draw the same line on a chart.
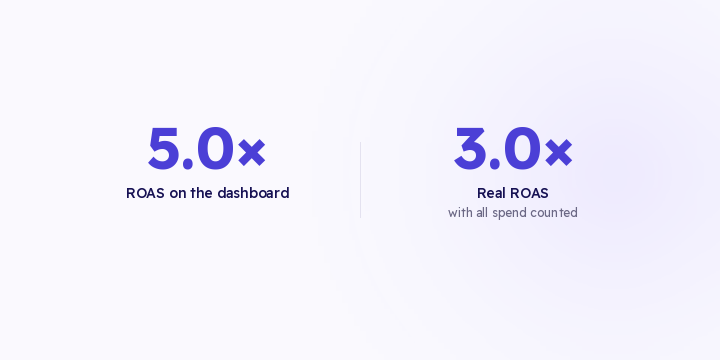
A 5.0 ROAS on the dashboard is worth checking before you celebrate. If 40% of your spend never matched a campaign, the denominator is short and the number is wrong in the direction you like.
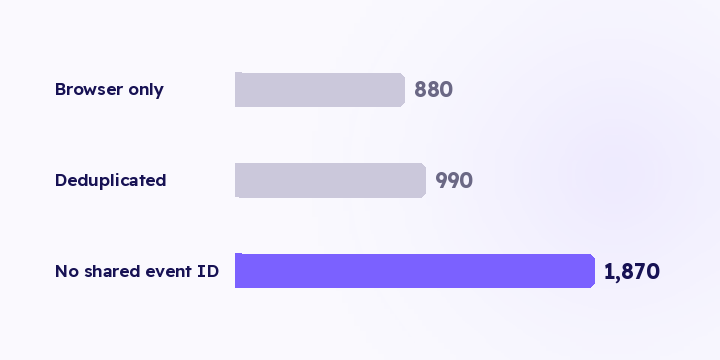
The browser pixel and server-side tracking complete each other. Without a shared event ID between them, the same order is counted twice and ROAS reads better than reality. Here's what each path sees, and where deduplication breaks.