

Attribution
How fourteen identifiers become one customer
A phone visit and a laptop purchase are two separate records. Here's what merges them, why backfilled history changes your attribution, and what moves in your numbers afterwards.
3 min read
Most of the customer numbers you report are averages. An average blends someone who bought once with someone who came back four times, and describes neither.
The problem is that this is the number you set acquisition budget against.
An illustrative store, 4,832 orders over 90 days:
| Group | Customers | Orders |
|---|---|---|
| Bought once | 2,000 | 2,000 |
| Bought twice | 800 | 1,600 |
| Bought four times | 308 | 1,232 |
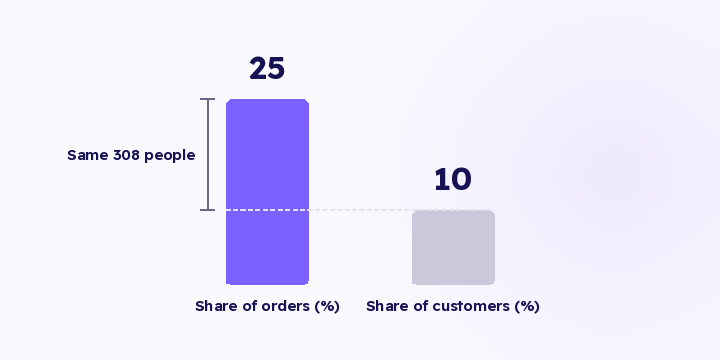
Those 308 customers are 10% of the base and produce 25% of the orders.
Any blended figure puts them in with the 2,000 people who bought once. An average order value across all three groups is a number no customer produced, and average lifetime value has the same problem. That's how a store ends up paying the same to acquire a customer worth 400 SAR and one worth 3,000.
Sort those 308 by the channel that brought them in.
If most came from one channel, that channel is worth more than its first-order return suggested, and every ranking that judged it on cost per order was missing something.
This sort moves budget allocation more than most attribution model debates, and it needs no model at all. It needs you to know which channel brought each customer, and every order they placed afterwards.
By acquiring channel. Which channels bring people who come back, and which bring one order and nothing after. That's the difference between buying customers and buying transactions, and it doesn't show up in cost per order.
By total spend. Your top 10% by spend usually behave differently from everyone else. They're the group most worth protecting and the least worth discounting to.
By date of last purchase. This gives you the lapse list, which is the most actionable segment available this week and the one most stores never build.
You can stack them: customers acquired from TikTok in the last 60 days who have spent more than 500 SAR. The question stops being technical and becomes commercial, and the answer is a list you can export, not a chart.
That's the test for whether a split is worth building: does it end in something you'd act on this week? If not, it's a report, and reports pile up. Three or four splits you actually use beat ten you saved.
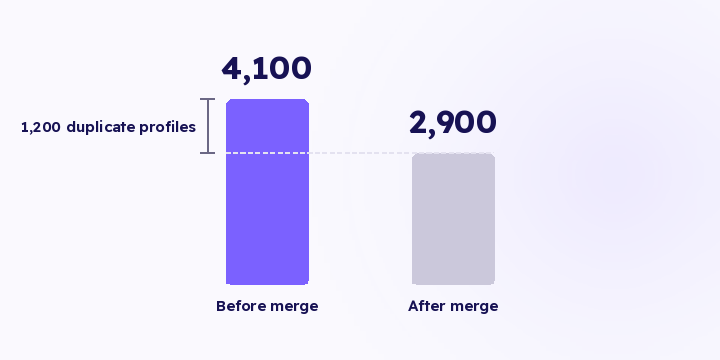
A customer appearing as three profiles counts as three one-time buyers. Your repeat rate reads lower than reality, your customer count reads higher, and the 308 group shrinks. More on that in identity resolution.
This isn't a small distortion. Your best customers are the ones who bought most often across the most devices, so they're the ones most likely to be duplicated in raw records.
In Flowfy, identity resolution, order-level source and customer records with full order history are live, so the splits above are computable and exportable. Cohort retention curves and lifetime value by first acquisition channel are on the roadmap and haven't shipped. See nCAC and cohorts.
So start there: pull your last 90 days of customers, rank them by order count, and check which channel brought the top group. If one channel dominates, move a small part of the acquisition budget toward it and watch your repeat rate for two months before moving more.
A phone visit and a laptop purchase are two separate records. Here's what merges them, why backfilled history changes your attribution, and what moves in your numbers afterwards.
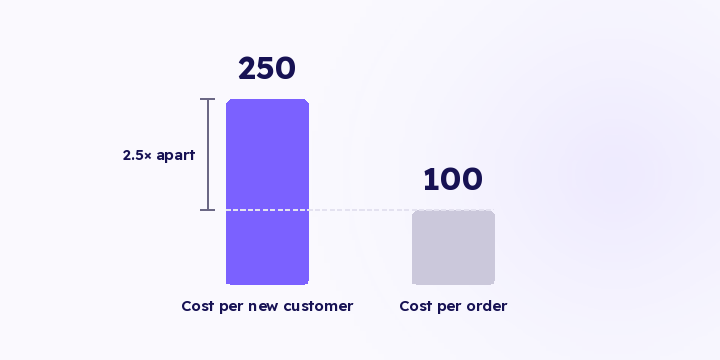
Spend divided by all orders flatters every campaign that resells to your own customers. Here's the arithmetic, and the order to work through to LTV by channel.
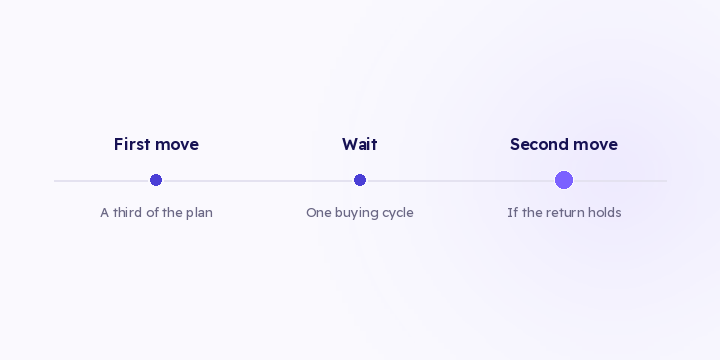
The distribution check tells you there's an opportunity. Moving it all at once eats most of it. Here are three execution rules, and what to watch afterwards.